NOTE: I have left Forex Factory, so don't expect replies to your posts. You can find an index to all my indicators and posts here.
Terms and Conditions
All code is supplied FREE of charge. It may NOT be sold or distributed commercially. Unless otherwise shown, no source code is available.
Software is offered on an 'as is' basis. I'm not offering a programming or troubleshooting service.
There is no guarantee that the software is fit for purpose, or free of errors. Download and use the indicator(s) at your own risk; I accept no liability for computer damage or financial losses.
___________________________
Display Info All Pairs indicator
This indicator will display the following info, for all currency pairs offered by your br0ker:
-- Symbol (A=AUD, C=CAD, E=EUR, F=CHF, G=GBP, J=JPY, N=NZD, U=USD)
-- Current bid price
-- Daily move from open, both as pips, and a % of the daily open price
-- Daily range to date:ave daily range (DR as a % of ADR) (note: Sunday candles not included in ADR)
-- Spread (spread as a % of ADR)
-- Dollars per pip (per full lot traded)
-- Swap paid(+) or charged(-) by br0ker on long and short positions
The indy produces the table in the lower right of the attached screenshot. 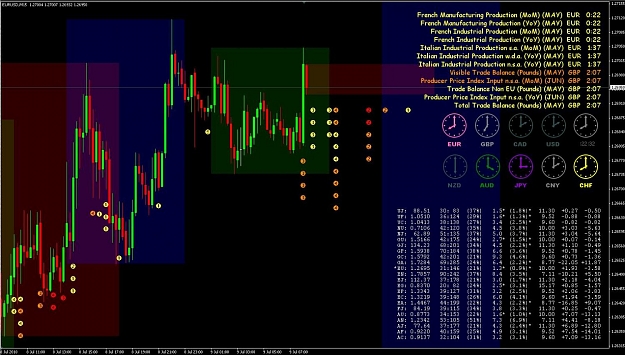
Note: if you set FullSymbolIDs = TRUE, then you'll need to set at least one of the other Show........ parameters to FALSE, to avoid truncation. MT4 allows a maximum of 62 characters in a text object's description.
This indicator has been updated. You can download the latest version here (both build509 and build600+ versions are available), or in the ZIP file attached to this post (#1).
___________________________
Critical Levels indicator
This indy displays colored lines at the RHS of your chart. You can select lines from any or all of the following:
--- prior daily, weekly and monthly highs/lows;
--- daily, weekly and monthly pivot levels (standard calculation)
--- daily, weekly and monthly pivot levels (fibo based calculation)
--- round numbers (xx00 and xx50)
See the screenshot below for an example. 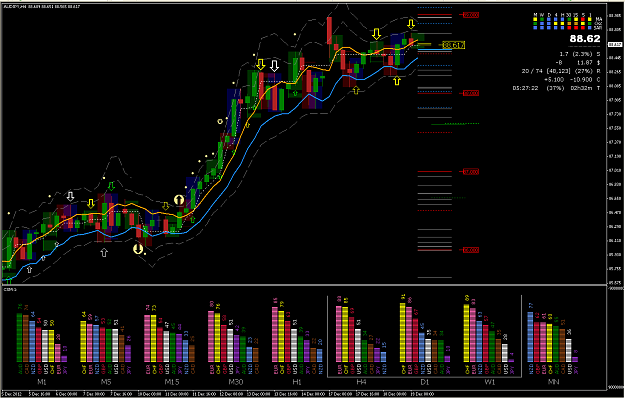
If you want a certain line type to display, select your desired color; it must be a valid MT4 color token, e.g. Red, SaddleBrown, Goldenrod, MediumViolet. If not, leave the parameter blank.
The indy will work if you simply copy the .ex4 file into your ..../experts/indicators folder. However, if you copy the .mq4 file there also, then you must also copy the two .mqh files here into your ..../experts/include folder, for the .mq4 to compile correctly. (Only a build509 version is currently available).
___________________________
Output History indicator & script
Either one of these will output OHLCV history to CSV files, simultaneously for up to 40 pairs/instruments, and 9 timeframes, allowing easy import to Excel. A separate file is created for each pair/timeframe combination. The script runs the job once; while the indicator runs it once every time a new price tick occurs, overwriting the relevant file(s).
Each bar in the chart occupies one line (row) in the file. Data in each row is output in the following order: date/time, open, high, low, close, volume
You can easily modify the source code to add additional values from MT4 indicators, by using MQL4 functions (e.g. iMA, iRSI, iBands, iCustom, etc).
INSTALLATION:
Copy the two .mqh files here into your ..../experts/include folder.
Copy the .mq4 (indicator) file into your ..../experts/indicators folder.
Copy the .mq4 (script) file into your ..../experts/scripts folder.
Then restart MT4.
(NOTE: Currently, only build509 versions are available).
PARAMETERS:
CurrencyPairs: leave blank to output only for the pair on whose chart the script/indicator is attached. Otherwise type in up to 40 pairs, separated by commas. Upper or lowercase doesn’t matter, and you may use the following abbreviations: A=AUD, C=CAD, F=CHF, E=EUR, G=GBP, J=JPY, N=NZD, U=USD. Hence you could type something like: EU,GU,UF,UJ which works the same as EURUSD,GBPUSD,USDCHF,USDJPY
TimeFrames: leave blank to output only for the timeframe on whose chart the script/indicator is attached. Otherwise type in up to 9 timeframes, separated by commas. Upper or lowercase doesn’t matter. For example, to output for all 9 timeframes, copy this:
M1,M5,M15,M30,H1,H4,D1,W1,MN
Hence the above entries would create 36 different files (4 pairs x 9 timeframes).
DifferentSubfolderPerTimeFrame: if set to FALSE, all files will be output to your …/experts/files folder. If set to TRUE, subfolders will automatically be created under this folder, e.g. …/experts/fiels/H1, and the output file(s) will be created in the subfolders.
Regardless of the folder, all files are named: [pair],[timeframe].CSV
LookbackBars: OHLCV values for the most recent (rightmost) ‘n’ bars will be output, where ‘n’ is the value you type here. If you specify either 0, or a very large number (e.g. 999999), then all values for all bars in the chart history will be output. WARNING: if using the indicator, then outputting a very large amount of data repeatedly on every price tick may bring MT4 to a standstill.
DescendingDateTimeOrder: if set to FALSE, data is output in chronological order, i.e. earliest bar values at the start of the file. If set to TRUE, data is output in reverse chronological order, i.e. most recent bar values at the start of the file.
OutputHeaderLine: if set to TRUE, it will output one line (row), with column headings, at the start of the file. If set to FALSE, no header line will be output.
FieldSeparator: set this to the delimiter character(s) you wish to appear between column vales that are outputs. Default is a comma (,).
EncloseValuesInQuotes: if set to TRUE, each data value will be enclosed in double quotes, e.g. “1.3659”.
DateTimeFormat, PriceFormat, etc: these are explained here.
Note that date and time, by default, are output as one field. If you want them to appear as separate fields, you must include a field separator (and quotes, if desired) inside the DateTimeFormat, e.g. M/D/Y","H:I
SAMPLE OUTPUT:
___________________________
Download Central Bank rates
(new: Nov 17,2018)
This executable app will download the bank OCR rates from this webpage for any currency/ies that you specify. A separate CSV file named cbrate_<country>.csv, showing the date and rate changes in chronological order, will be created for each bank, in the folder where the app is installed. The format of each file looks like this:
Simply unzip the attached file to obtain the EXE file, which you can install and run from any folder that you wish (including your desktop).
The app was written using Autohotkey, and no source code is available.
Terms and Conditions
All code is supplied FREE of charge. It may NOT be sold or distributed commercially. Unless otherwise shown, no source code is available.
Software is offered on an 'as is' basis. I'm not offering a programming or troubleshooting service.
There is no guarantee that the software is fit for purpose, or free of errors. Download and use the indicator(s) at your own risk; I accept no liability for computer damage or financial losses.
___________________________
Display Info All Pairs indicator
This indicator will display the following info, for all currency pairs offered by your br0ker:
-- Symbol (A=AUD, C=CAD, E=EUR, F=CHF, G=GBP, J=JPY, N=NZD, U=USD)
-- Current bid price
-- Daily move from open, both as pips, and a % of the daily open price
-- Daily range to date:ave daily range (DR as a % of ADR) (note: Sunday candles not included in ADR)
-- Spread (spread as a % of ADR)
-- Dollars per pip (per full lot traded)
-- Swap paid(+) or charged(-) by br0ker on long and short positions
The indy produces the table in the lower right of the attached screenshot.
Attached Image (click to enlarge)
Note: if you set FullSymbolIDs = TRUE, then you'll need to set at least one of the other Show........ parameters to FALSE, to avoid truncation. MT4 allows a maximum of 62 characters in a text object's description.
Attached File(s)
This indicator has been updated. You can download the latest version here (both build509 and build600+ versions are available), or in the ZIP file attached to this post (#1).
___________________________
Critical Levels indicator
This indy displays colored lines at the RHS of your chart. You can select lines from any or all of the following:
--- prior daily, weekly and monthly highs/lows;
--- daily, weekly and monthly pivot levels (standard calculation)
--- daily, weekly and monthly pivot levels (fibo based calculation)
--- round numbers (xx00 and xx50)
See the screenshot below for an example.
Attached Image (click to enlarge)
If you want a certain line type to display, select your desired color; it must be a valid MT4 color token, e.g. Red, SaddleBrown, Goldenrod, MediumViolet. If not, leave the parameter blank.
The indy will work if you simply copy the .ex4 file into your ..../experts/indicators folder. However, if you copy the .mq4 file there also, then you must also copy the two .mqh files here into your ..../experts/include folder, for the .mq4 to compile correctly. (Only a build509 version is currently available).
Attached File(s)
Attached File(s)
___________________________
Output History indicator & script
Either one of these will output OHLCV history to CSV files, simultaneously for up to 40 pairs/instruments, and 9 timeframes, allowing easy import to Excel. A separate file is created for each pair/timeframe combination. The script runs the job once; while the indicator runs it once every time a new price tick occurs, overwriting the relevant file(s).
Each bar in the chart occupies one line (row) in the file. Data in each row is output in the following order: date/time, open, high, low, close, volume
You can easily modify the source code to add additional values from MT4 indicators, by using MQL4 functions (e.g. iMA, iRSI, iBands, iCustom, etc).
INSTALLATION:
Copy the two .mqh files here into your ..../experts/include folder.
Copy the .mq4 (indicator) file into your ..../experts/indicators folder.
Copy the .mq4 (script) file into your ..../experts/scripts folder.
Then restart MT4.
(NOTE: Currently, only build509 versions are available).
PARAMETERS:
CurrencyPairs: leave blank to output only for the pair on whose chart the script/indicator is attached. Otherwise type in up to 40 pairs, separated by commas. Upper or lowercase doesn’t matter, and you may use the following abbreviations: A=AUD, C=CAD, F=CHF, E=EUR, G=GBP, J=JPY, N=NZD, U=USD. Hence you could type something like: EU,GU,UF,UJ which works the same as EURUSD,GBPUSD,USDCHF,USDJPY
TimeFrames: leave blank to output only for the timeframe on whose chart the script/indicator is attached. Otherwise type in up to 9 timeframes, separated by commas. Upper or lowercase doesn’t matter. For example, to output for all 9 timeframes, copy this:
M1,M5,M15,M30,H1,H4,D1,W1,MN
Hence the above entries would create 36 different files (4 pairs x 9 timeframes).
DifferentSubfolderPerTimeFrame: if set to FALSE, all files will be output to your …/experts/files folder. If set to TRUE, subfolders will automatically be created under this folder, e.g. …/experts/fiels/H1, and the output file(s) will be created in the subfolders.
Regardless of the folder, all files are named: [pair],[timeframe].CSV
LookbackBars: OHLCV values for the most recent (rightmost) ‘n’ bars will be output, where ‘n’ is the value you type here. If you specify either 0, or a very large number (e.g. 999999), then all values for all bars in the chart history will be output. WARNING: if using the indicator, then outputting a very large amount of data repeatedly on every price tick may bring MT4 to a standstill.
DescendingDateTimeOrder: if set to FALSE, data is output in chronological order, i.e. earliest bar values at the start of the file. If set to TRUE, data is output in reverse chronological order, i.e. most recent bar values at the start of the file.
OutputHeaderLine: if set to TRUE, it will output one line (row), with column headings, at the start of the file. If set to FALSE, no header line will be output.
FieldSeparator: set this to the delimiter character(s) you wish to appear between column vales that are outputs. Default is a comma (,).
EncloseValuesInQuotes: if set to TRUE, each data value will be enclosed in double quotes, e.g. “1.3659”.
DateTimeFormat, PriceFormat, etc: these are explained here.
Note that date and time, by default, are output as one field. If you want them to appear as separate fields, you must include a field separator (and quotes, if desired) inside the DateTimeFormat, e.g. M/D/Y","H:I
SAMPLE OUTPUT:
Inserted Code
Date,Time,Open,High,Low,Close,Volume
"12/21/2012","04:00","87.970","87.984","87.584","87.804","18961"
"12/21/2012","08:00","87.803","87.965","87.582","87.609","15917"
"12/21/2012","12:00","87.607","87.847","87.560","87.603","12136"
"12/21/2012","16:00","87.602","87.871","87.530","87.686","18678"
"12/21/2012","20:00","87.686","87.724","87.538","87.599","7838"
"12/24/2012","00:00","87.707","87.870","87.652","87.734","9248"
"12/24/2012","04:00","87.736","87.818","87.687","87.813","4924"
"12/24/2012","08:00","87.810","87.915","87.780","87.811","5634"
"12/24/2012","12:00","87.812","87.891","87.741","87.811","6903"
"12/24/2012","16:00","87.811","87.994","87.793","87.938","5883"
"12/26/2012","01:00","88.053","88.412","88.006","88.348","13701"
"12/26/2012","05:00","88.348","88.476","88.308","88.398","7351"
"12/26/2012","09:00","88.398","88.608","88.347","88.433","10198"
"12/26/2012","13:00","88.433","88.642","88.350","88.576","10997"
"12/26/2012","17:00","88.576","88.770","88.427","88.766","12260"
"12/26/2012","21:00","88.766","88.842","88.715","88.837","4481"
"12/27/2012","00:00","88.833","88.886","88.620","88.832","10180"
"12/27/2012","04:00","88.835","88.948","88.755","88.803","10334"
"12/27/2012","08:00","88.803","88.970","88.765","88.945","9994"
"12/27/2012","12:00","88.944","89.119","88.902","89.065","9441"
Attached File(s)
Attached File(s)
___________________________
Download Central Bank rates
(new: Nov 17,2018)
This executable app will download the bank OCR rates from this webpage for any currency/ies that you specify. A separate CSV file named cbrate_<country>.csv, showing the date and rate changes in chronological order, will be created for each bank, in the folder where the app is installed. The format of each file looks like this:
Inserted Code
2001.01.03,6.00
2001.01.31,5.50
2001.03.20,5.00
2001.04.18,4.50
2001.05.15,4.00
2001.06.01,3.75
2001.08.21,3.50
2001.09.17,3.00
2001.10.02,2.50
2001.11.06,2.00
2001.12.11,1.75
2002.06.25,1.00
2002.11.06,1.25
2003.06.25,1.00
2004.06.30,1.25
Simply unzip the attached file to obtain the EXE file, which you can install and run from any folder that you wish (including your desktop).
Attached File(s)
The app was written using Autohotkey, and no source code is available.