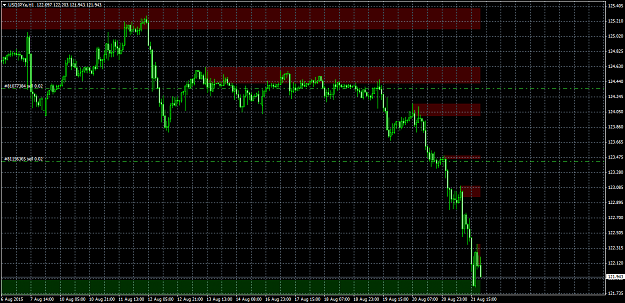
I'm brainstorming ways to make an indicator that would auto-identity the strongest support and resistance levels for the current price. The idea would be that the lines should be drawn where there is high-contrast between where price has been multiple times and where price has not been. Hopefully that makes some sense.
Does anyone have any expirence with this?
So far this is what I have:
1) At the first run, go back X bars and for each bar, add a count to every x.xxx5 level that price crosses. Having the indicator only look at x.xxx5 vs x.xxx1 (each pip) should smooth the trendlines some.
2) There will be a decaying factor, so that the more recent a bar is, the greater its influnce. I would probably have a user defined variable such as "0.5", meaning that the last bar(wheather it's 1000 bars back or 10000) would only be 50% as relavant(0.5 count) as the most recent bar.
3) Then I would organize my data in such a way so that I could find the levels that were both crossed frequently, AND next to other levels that were barely crossed at all. This is the part I need help on the most.
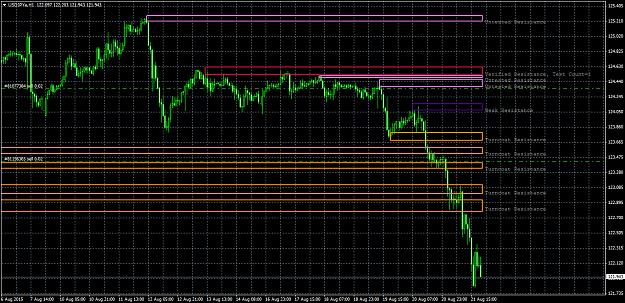
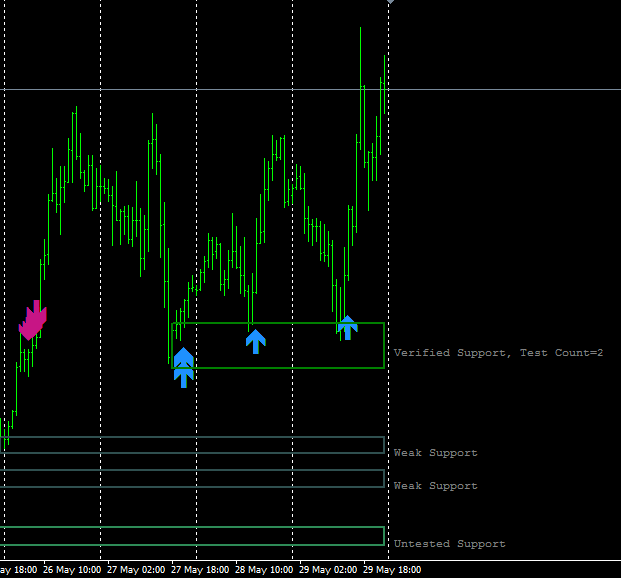
4) Then list these new areas by accending contrast, so that users could query for example, "The 3 closest areas of support(areas of greatest contrast between price movement and no price movement below the current price) and the 3 closest areas of resistance(areas of greatest contrast between price movement and no price movement above the current price)...and have these 6 lines drawn on the chart.
5) And then re-check every bar for developing areas of support and resistance.
I know it can't be rocket science to program it, so prehaps somone has already made such an indicator since support and resistance lines are so fundamental to profitable trading. I've never had any formal programming education so that's why I'm putting this out.
Does anyone have any expirence with this?
So far this is what I have:
1) At the first run, go back X bars and for each bar, add a count to every x.xxx5 level that price crosses. Having the indicator only look at x.xxx5 vs x.xxx1 (each pip) should smooth the trendlines some.
2) There will be a decaying factor, so that the more recent a bar is, the greater its influnce. I would probably have a user defined variable such as "0.5", meaning that the last bar(wheather it's 1000 bars back or 10000) would only be 50% as relavant(0.5 count) as the most recent bar.
3) Then I would organize my data in such a way so that I could find the levels that were both crossed frequently, AND next to other levels that were barely crossed at all. This is the part I need help on the most.
4) Then list these new areas by accending contrast, so that users could query for example, "The 3 closest areas of support(areas of greatest contrast between price movement and no price movement below the current price) and the 3 closest areas of resistance(areas of greatest contrast between price movement and no price movement above the current price)...and have these 6 lines drawn on the chart.
5) And then re-check every bar for developing areas of support and resistance.
I know it can't be rocket science to program it, so prehaps somone has already made such an indicator since support and resistance lines are so fundamental to profitable trading. I've never had any formal programming education so that's why I'm putting this out.