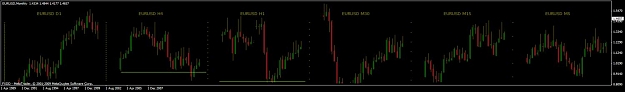
If you are like me, you like to view price action in multiple time frames e.g. Daily, 4 hour, 1 hour, 15 min etc. I wanted a way of dragging a currency symbol on to a window and have multiple time frame charts appear simultaneously in that window. This birthed the idea of “Mini Charts”.
I'll keep this post updated with latest version and manual.
## Note: You now need the stratman.fon font (in zip file attached) ##
Edit: 1 Dec 2009: Version 3.0 click here for videos on setup and use
Edit: Added Moving averages to Version 2.0 - 16/10/2009
Version 2.0 - 05/10/2009
1 Modified for the 'Stratman' Font Type
2 Reduced MultiMode to max of 30 charts
3 Autoscaling of bar count
4 Simulator Mode Added - calcs higher time frames from main chart
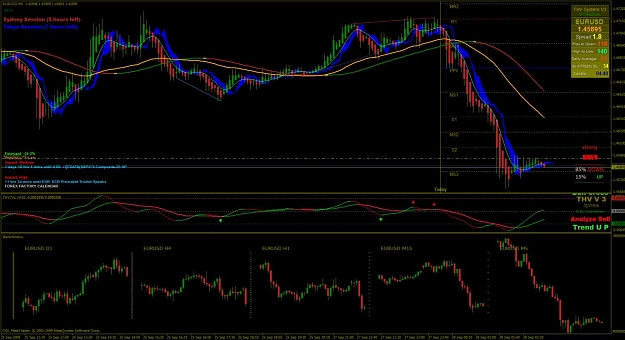
See the picture below and download the font, indicator and manual from here.
I'll keep this post updated with latest version and manual.
## Note: You now need the stratman.fon font (in zip file attached) ##
Edit: 1 Dec 2009: Version 3.0 click here for videos on setup and use
Edit: Added Moving averages to Version 2.0 - 16/10/2009
Version 2.0 - 05/10/2009
1 Modified for the 'Stratman' Font Type
2 Reduced MultiMode to max of 30 charts
3 Autoscaling of bar count
4 Simulator Mode Added - calcs higher time frames from main chart
See the picture below and download the font, indicator and manual from here.
Attached Image (click to enlarge)
Attached File(s)