After I read Jperl's excellent market statistics series at Traders Laboratory, I decided to code them in MQL for metatrader. Here is a summary document:
Here is my google drive link for some of the videos: Drive
They are in swf format, so it is a bit tricky to play them back. You are on your own there.
UPDATE: Someone(@mxqorlinz7489) had uploaded them into youtube some time ago. I downloaded and added them to the google drive.
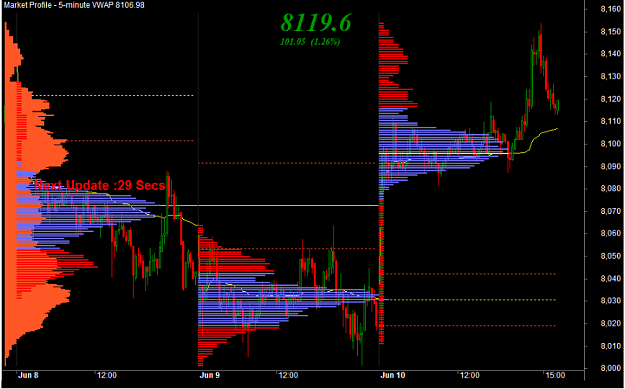
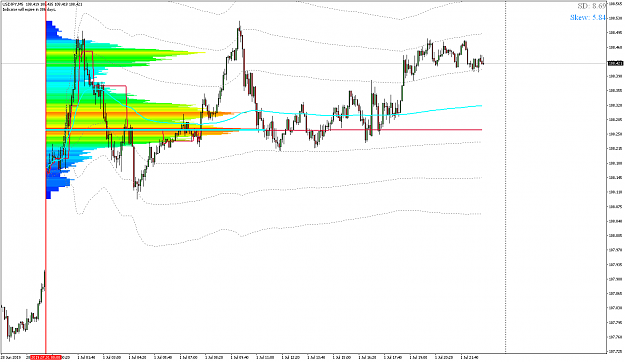
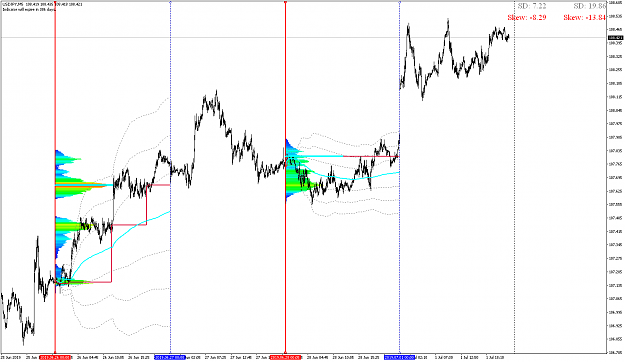
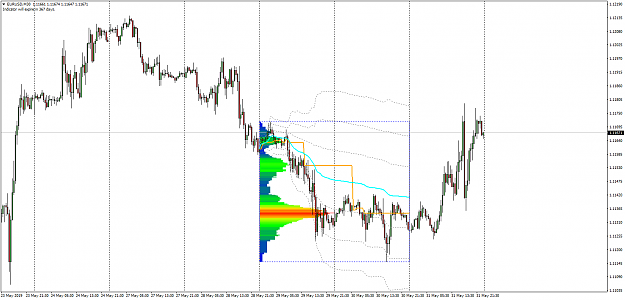
PVP represent Peak Volume Price and shows the price from StartDate with highest volume.
VWAP is the average of the volume distribution.
SD stands for Standart Deviation and you can plot 3 SD bands around VWAP.
I hope this will be helpful for someone.
Have a nice one.
Akif,
Drag indicator:
Rectangle Indicator:
 Akif_Rectangle_Market_Statistics_v3_NoExpire.mq4
27 KB
|
1,140 downloads
|
Uploaded Oct 6, 2021 12:50pm
Akif_Rectangle_Market_Statistics_v3_NoExpire.mq4
27 KB
|
1,140 downloads
|
Uploaded Oct 6, 2021 12:50pm
Akif,
Attached File(s)
Here is my google drive link for some of the videos: Drive
They are in swf format, so it is a bit tricky to play them back. You are on your own there.
UPDATE: Someone(@mxqorlinz7489) had uploaded them into youtube some time ago. I downloaded and added them to the google drive.
PVP represent Peak Volume Price and shows the price from StartDate with highest volume.
VWAP is the average of the volume distribution.
SD stands for Standart Deviation and you can plot 3 SD bands around VWAP.
I hope this will be helpful for someone.
Have a nice one.
Akif,
Drag indicator:
Attached Image (click to enlarge)
Attached Image (click to enlarge)
Attached File(s)
Rectangle Indicator:
Attached Image (click to enlarge)
Attached File(s)
Akif,