I'm working on a new kind of analysis for the Euro/USD based on zones of buy and sell pressure on the 4hr and Daily TF. I've been posting a little of it over on the Eur/USD thread but I don't want to keep bothering them over there with this, especially since a lot of new traders are there and I don't want to influence their trades with an experimental system.
I welcome others to join in and help figure out how this system can be improved. I've created the basic structure already, and I'm now following price movement in real time to see how true it proves, demo trading it.
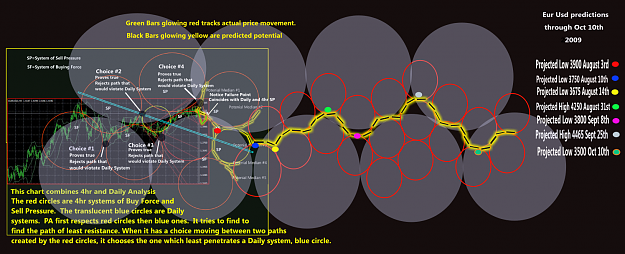
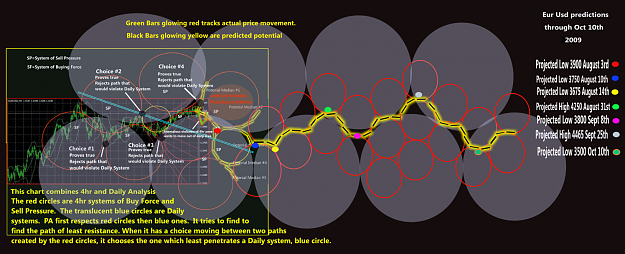
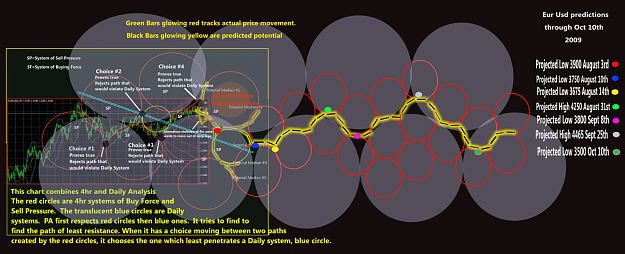
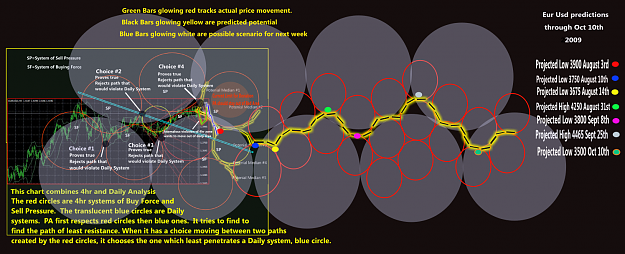
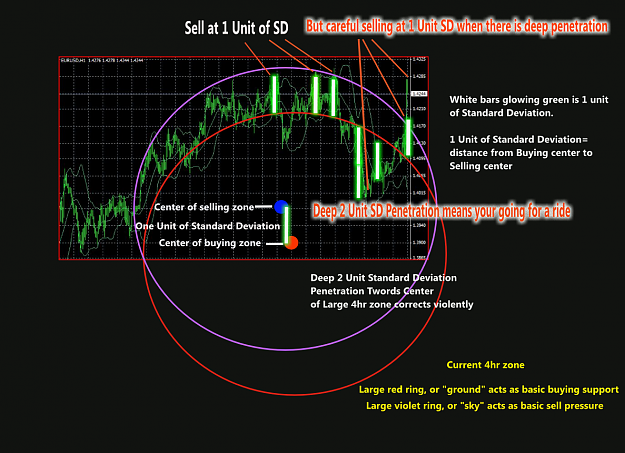
This started with basic observations of the 4hr Eur/USD chart. I noticed how it was trending in circular patterns. So I started filling in the spaces with circles. I then started examining the Daily charts and did the same thing. Then I combined the Daily Zones of Sell Pressure and Buy Force with the 4hr zones, into one comprehensive chart.
The rules of the system are simple. Price moves around the various zones and does not like to penetrate them. The smaller 4hr zones are respected more than the larger Daily Zones. The 4hr Zones create pathways for the price to move through. When there is a choice of two 4hr pathways, Price chooses the one which least violates the larger Daily system.
The Chart I'm including shows predictions based on this activity into October 2009. The farther you try to map these circular zones into the future however, the less reliable the results should be, or so I assume.
Again, this is experimental. I only demo trade this for fun, and to learn what I can about how these zones affect Price movement, and what can be learned about their predictive rules. As time goes on and price continues to reveal itself, it should provide a good foundation for a lot of interesting analysis of the system.
PLEASE SEE MOST RECENT CHARTS HERE-GREATLY REFINED AND CORRECTED
http://www.forexfactory.com/showpost...3&postcount=40
I welcome others to join in and help figure out how this system can be improved. I've created the basic structure already, and I'm now following price movement in real time to see how true it proves, demo trading it.
This started with basic observations of the 4hr Eur/USD chart. I noticed how it was trending in circular patterns. So I started filling in the spaces with circles. I then started examining the Daily charts and did the same thing. Then I combined the Daily Zones of Sell Pressure and Buy Force with the 4hr zones, into one comprehensive chart.
The rules of the system are simple. Price moves around the various zones and does not like to penetrate them. The smaller 4hr zones are respected more than the larger Daily Zones. The 4hr Zones create pathways for the price to move through. When there is a choice of two 4hr pathways, Price chooses the one which least violates the larger Daily system.
The Chart I'm including shows predictions based on this activity into October 2009. The farther you try to map these circular zones into the future however, the less reliable the results should be, or so I assume.
Again, this is experimental. I only demo trade this for fun, and to learn what I can about how these zones affect Price movement, and what can be learned about their predictive rules. As time goes on and price continues to reveal itself, it should provide a good foundation for a lot of interesting analysis of the system.
PLEASE SEE MOST RECENT CHARTS HERE-GREATLY REFINED AND CORRECTED
http://www.forexfactory.com/showpost...3&postcount=40
Attached Image (click to enlarge)