Hi.
I have created a new indicator which shows the strength of each (individual) currency based on change percentage. Change percentage of each currency at any time (in a day) according to the open price of the day is calculated according to the following formula:
(the formula is edited)
for ( j = each pair of currency )
currency[i] = currency[i] + ( iClose( Pair[j] , Period() , i ) - iOpen( Pair[j] , PERIOD_D1 , dayCount ) ) / iOpen( Pair[j] , PERIOD_D1 , dayCount ) * 100;
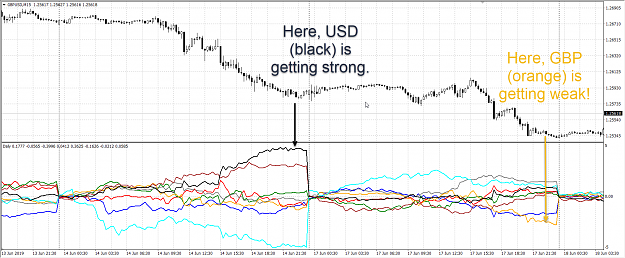
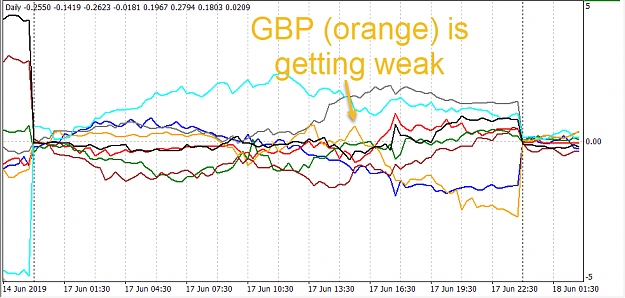
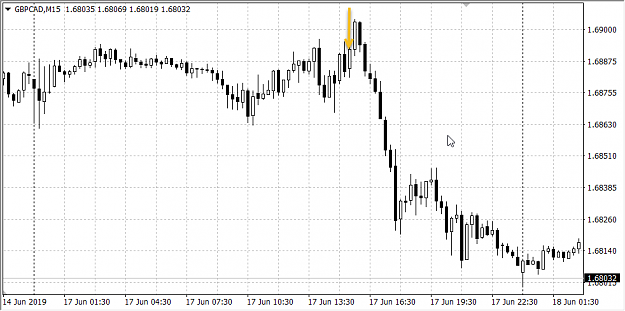
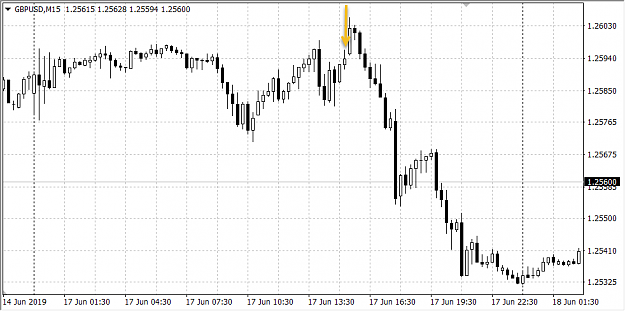
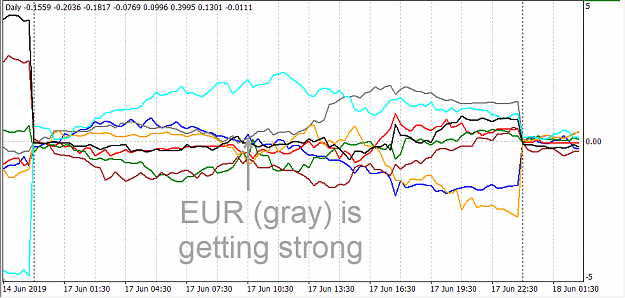
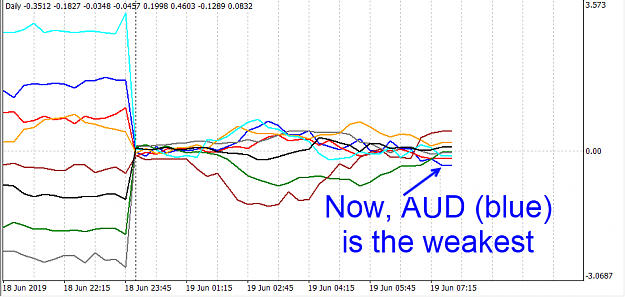
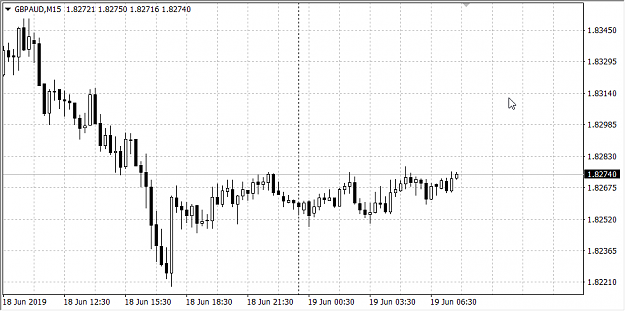
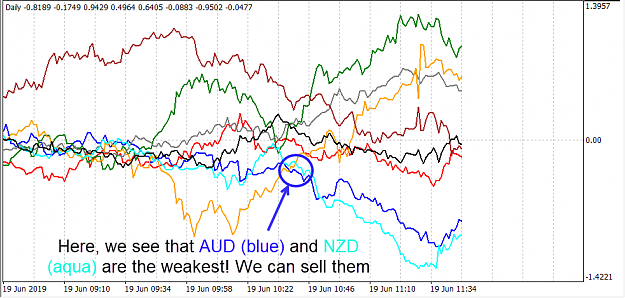
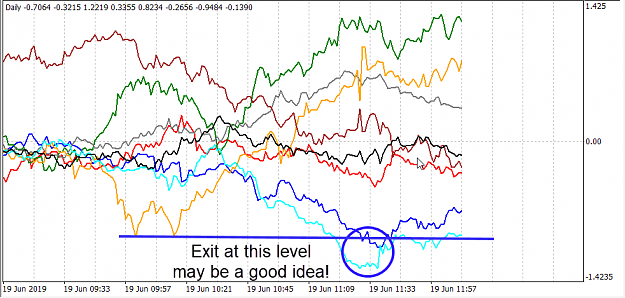
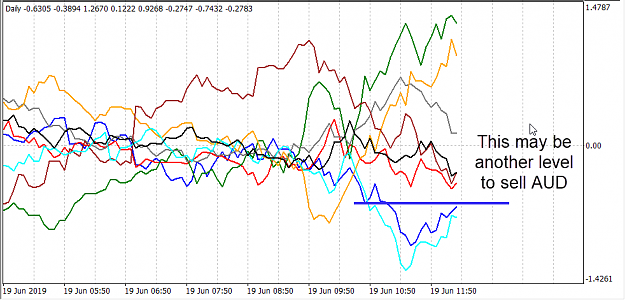
Here is a view of the indicator:
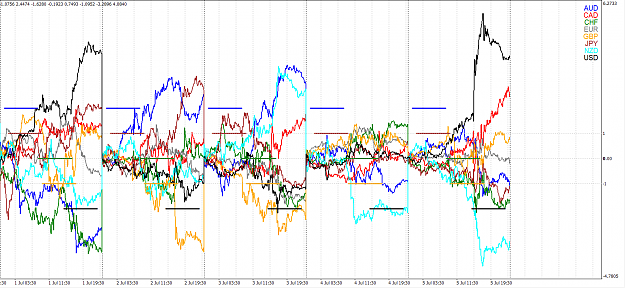
About the figure:
- Colors:
AUD: Blue
CAD: Red
CHF: Green
EUR: Gray
GBP: Orange
JPY: Brown
NZD: Aqua
USD: Black
- Each signal (curve) belongs to one currency (not an individual pair).
I notice to the followings:
- The sum of the buffers (currencies strength) at any time is zero! This shows the balance of the system.
- If the idea is that the strength of a currency is to be increased, that currency should be bought.
- If the idea is that the strength of a currency is to be decreased, that currency should be sold.
- An example of buying USD, for example, is: Sell(AUDUSD), Sell(EURUSD), Sell(GBPUSD), Sell(NZDUSD), Buy(USDCAD), Buy(USDCHF), Buy(USDJPY).
- An example of selling USD, for example, is: Buy(AUDUSD), Buy(EURUSD), Buy(GBPUSD), Buy(NZDUSD), Sell(USDCAD), Sell(USDCHF), Sell(USDJPY).
- If the strength of a currency is to be increased (decreased), all pairs of that currency should be bought (sold), otherwise, there is no guarantee to gain profit from this trade.
Still, there is an ambiguity in trading with the help of this indicator. I have no idea when the strength of a currency is to be increased or decreased. I didn't find any general template or strategy to trade with this indicator.
I share the indicator here to find a way or strategy to trade with the help of it.
Please share if you have any idea.
Please, if you attach the indicator to a chart, refresh all the other (27) charts to update and download tick data.
Weekly indicator is added. In this indicator, the opening price of the week is considered to measure strength or weakness of a currency.
*** Strength Percentage
Version 1.00: is archived.
Version 1.01: Code is optimized for faster calculation and lower memory (is archived).
Version 1.03: Vertical line and alert flags are added (is archived).
Version 1.04: Alert + Vertical line + Signal color (is archived).
Version 2.00: Symbols prefix and suffix + Session indicator + Currencies Label + Current pair detection (Description here).
Daily strength indicator:
*** Pips
With the help of comments, I have created a new version of the indicator which calculates the pips changes for each currency. This indicator gives exact pips when we trade a currency.
In addition, a new feature is added to the indicator, which is drawing the vertical lines with user defined periods. The problem of vertical lines is solved. This helps the trader better know how the currency changes in periods:
Version 101: is archived.
Version 102: is archived.
Version 104: Alert + Vertical line + Signal color.
Daily pips change indicator:
Weekly pips change indicator:
*** RSI
The RSI of the signals are calculated in this indicator. RSI period can be determined by user. The currencies can be chosen to be displayed or not.
(Bugs are fixed and the indicator is rewritten.)
RSI of pips change indicator:
*** COT of strength (Currency Strength Index, CSI)
Version 1.00: is archived.
Version 1.01: Symbols prefix and suffix + Session indicator + Currencies Label + Current pair detection.
Daily CSI indicator:
*** Archive