M TTT M
[MML TRIPLE TRIANGULATED TRADING METHOD]
**************************************************************************************************************
Whilst the trading results of the Thread Ops Real account may not be easily reproducible by the average trader, it is my wish to have at least
a few traders follow the MTTTM methodology and produce at least minimal net positive and consistent results !
At the end of the day it is the determination and perserverance of the trader that greatly decides whether success will follow or not.
If the market knocks you down, pick yourself up and strive to conquer it.
Focus on the goal, set milestones, put your mind into gear, make sense of the market chaos and strive to conquer it.
There is no place for losers in this business, either generate profit or throw your money to the wolves.
What trader do you want to be ?
**************************************************************************************************************Please apply only the indicators, templates and other tools found in the zip folder.
Do not use other indicators or templates that have been sourced from elsewhere.
In general all lagging type indicators are banned from this thread including but not limited to the following:
CCI is banned;
MACD is banned;
Moving Average is banned;
RSI is banned;
Stochastics is banned;
TDI (or any variant) is banned;
Williams in any format is banned;
All 'lagging' and 'oscillating' indicators are banned unless they appear in the Zip folder attached to Post 1.
Exceptions that are allowed to be used are as follows:
GANN (projections of price in time and trading frame constructions that mimic the MTTTM Strategy)
HURST CYCLES (for cyclic discussion purposes only NOT as a stand alone trading method)
**************************************************************************************************************
The MTTTM Trading Strategy.
Please note that the MTTTM trading strategy uses levels based off the MML indicator originally coded in 2004 by Vladislav Goshkov.
Entry, Stop Loss and Take Profit levels are also aligned with the MML price lines (13) as per the indicator settings.
The MTTTM strategy applies multiple symbols in groups of 3's in a triangulated format using a high reward to risk ratio.
At no time does this method apply anything whatsoever to do with the Murrey Math Trading System.
It does not apply any of the Murrey Math Trading software in any form whatsoever.
It only uses the 13 MML lines as generated by the MML indicator and nothing else.
I do reserve the right to modify and manipulate the original indicator as provided by the original author of the code.
Such changes I have made to the code include advanced functionality, user choice of 0/8 and 8/8 price levels, MML levels based on fixed End of Day data from metaquotes or any other preferred data feed and numerous other additional features both in mq4 and mq5 format.
Other adapted versions of code may also be in C++, Java, Python and MatLab.
As always use the provided tools at your own risk and note that such tools are provided to traders as an aid to their trading in an as is condition.
Non-commercial software is only provided here so do not expect a perfect and flawless solution in all cases.
The Plan for the MTTTM Strategy
1. Start off with trading demo examples of 8 scenarios of M15 TF TS Order 3 setups on an 'almost random' type approach;
[transparent trading approach before the fact, discuss trades, discuss ways to improve strike rate]
2. Trade (on demo) a specially designed TS Order 3 on the M15 TF with several traded setups;
[transparent trading approach before the fact, discuss trades, discuss ways to improve strike rate]
3. Trade (on demo) higher time frame TS Order 3's (and higher TS Order examples)
[transparent trading approach before the fact, discuss trades, discuss ways to improve strike rate]
4. Trade (on live) carefully designed TS Order 3's (and others).
[transparent trading approach before the fact, discuss trades (before, during and after), discuss techniques that attempt to improve the strike rate]
The M15/M5 MML template is applied using P=64 and MMP=60 settings across a triangulated format.
Attached Image (click to enlarge)
Triangulated Set (TS):
1 TS set is comprised of 3 pairs where 2 pairs form a cross pair such as EURUSD and GBPUSD form EURGBP (all 3 pairs are traded in a setup)
TS 1 = EURUSD + GBPUSD = EURGBP ... also referred to as a TS Order 1
2 TS sets would then form 6 pairs
TS 1 = EURUSD + GBPUSD = EURGBP
TS 2 = AUDCAD + EURCAD = EURAUD ... also referred to as a 2 TS's
3 TS sets would then form 9 pairs
TS 1 = EURUSD + GBPUSD = EURGBP
TS 2 = AUDCAD + EURCAD = EURAUD
TS 3 = AUDCHF + GBPCHF = GBPAUD ... also referred to as a TS Order 3
Triple Triangulated Set (TT Set):
A triple triangulated set (TT set) is 3 by TS sets so it is comprised of 9 pairs and is also referred too as a TS Order 3.
TS 1 = EURUSD + GBPUSD = EURGBP
TS 2 = AUDCAD + EURCAD = EURAUD
TS 3 = AUDCHF + GBPCHF = GBPAUD
Valid trading TS Order setups are comprised of an odd number of pairs:
TS Order 1 would trade 3 pairs
TS Order 3 would trade 9 pairs
TS Order 5 would trade 15 pairs
TS Order 7 would trade 21 pairs
Note: Even Order TS's are NOT valid setups in the MTTTM trading strategy!
Pure Triple Triangulated Set is a minimum TS Order 3 (9 pairs) or any whole digit multiple of the TS Order 3 structure such as:
2*TS Order 3 [2*9=18 pairs]
3*TS Order 3 [3*9=27 pairs]
4*TS Order 3 [4*9=36 pairs]
5*TS Order 3 [5*9=45 pairs]
...
...
N*TS Order 3 [N*9=9N pairs] where N is any positive whole digit.
Note: A TS (a group of 3 triangulated currency pairs) may not be repeated in a TS Order setup UNLESS at least 1 pair's direction is different.
Grand TS Order 3's
A Grand N*TS Order 3 is the complete tradeable setup comprised of either 9, 18, 27, 36, 45 up to 9*N pairs.
TS Order 3 is comprised of TS1 (3 pairs), TS2 (3 pairs) and TS3 (3 pairs) ... each TS is comprised of 3 triangulated pairs ... so a TS Order 3 contains a total of 9 pairs !
TS Order 3 (^2) is comprised of TS1, TS2, TS3, TS4, TS5, TS6, TS7, TS8 and TS9 ... 9 triangulated pairs ... in total 27 pairs !
Most commonly traded TS Set in this thread will be TS Order 3 (9 individual pairs).
Smaller account balances should apply the lower order TS’s.
Higher account balances have more flexibility and may consider higher order TS’s.
Risk per trade and total risk across the account is at the trader’s discretion however, I will outline throughout the thread several examples of how I apply risk management to these setups.
Ultimately the trader is responsible for his/her trading decisions be it trade or risk management.
Example of a Triangulated Set of Order 1 (1 by 3 pairs):
Triangulated Set 1 = 2 short + 1 long or vice versa such as EURUSD (S), GBPUSD (S) + EURGBP (L)
Trade #1 = short EURUSD
Trade #2 = short GBPUSD
Trade #3 = long EURGBP
Example of a Triangulated Set of Order 3 (3 by 3 pairs = 9 pairs):
Triangulated Set 1 = 2 short + 1 long or vice versa such as EURUSD (S), GBPUSD (S) + EURGBP (L)
Triangulated Set 2 = 2 long + 1 short or vice versa such as AUDUSD (L), NZDUSD (L) + AUDNZD (S)
Triangulated Set 3 = 2 short + 1 long or vice versa such as GBPJPY (S), GBPCHF (S) + CHFJPY (L)
Trade #1 = short EURUSD
Trade #2 = short GBPUSD
Trade #3 = long EURGBP
Trade #4 = long AUDUSD
Trade #5 = long NZDUSD
Trade #6 = short AUDNZD
Trade #7 = short GBPJPY
Trade #8 = short GBPCHF
Trade #9 = long CHFJPY
Other variations to direction are also possible.
Higher order triangulated sets simply follow along a similar line of logic.
A TS of Order 5 would apply 15 individual trades in the setup
A TS of Order 7 would apply 21 individual trades in the setup
A TS of Order 9 would apply 27 individual trades in the setup
A TS of Order 11 would apply 33 individual trades in the setup
Sooner or later a limit is reached in terms of the TS Order applied since the pair offerings from a given broker may not be suitable for a host of different reasons.
MT4 (or MT5, cTrader or other platform) will be used in this methodology.
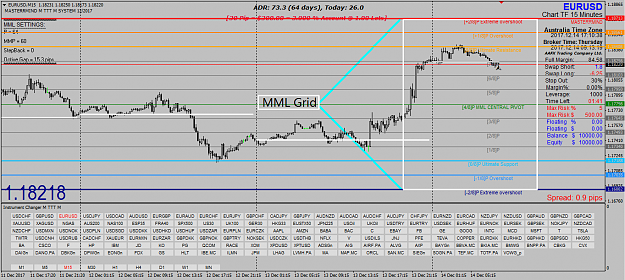
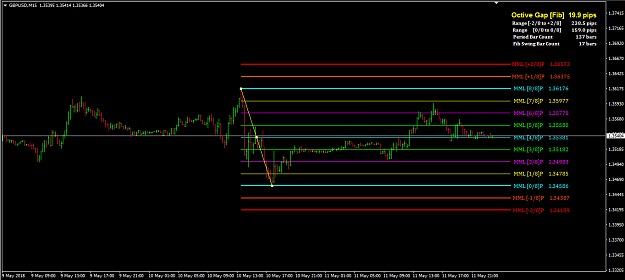
MML levels:
A minimal understanding of the MML Grid is required.
Attached Image (click to enlarge)
There are 13 MML lines -2/8, -1/8, 0/8, 1/8, 2/8, 3/8, 4/8, 5/8, 6/8, 7/8, 8/8, +1/8 and +2/8.
These 13 MML lines form 12 Octaves
The distance in pips between 2 MML lines is also referrred to as the Octave Gap.
Multiples of the Octave Gap are used for the SL and also TP (1 Octave Gap_SL : 4 Octave Gap_TP).
Note: Typically the SL is projected as a muliple (using up to 2 decimal places) of the octave gap in the range [1 ... 2].
For example,
MINIMUM SL = 1*Octave Gap and TP = 4*Octave Gap
...
...
SL = 1.1*Ocatve Gap and TP = 4.4*Octave Gap
...
...
SL = 1.25*Octave Gap and TP = 5*Octave Gap
...
...
SL = 1.5*Ocatve Gap and TP = 6*Octave Gap
...
...
MAXIMUM SL = 2*Octave Gap and TP = 8*Octave Gap
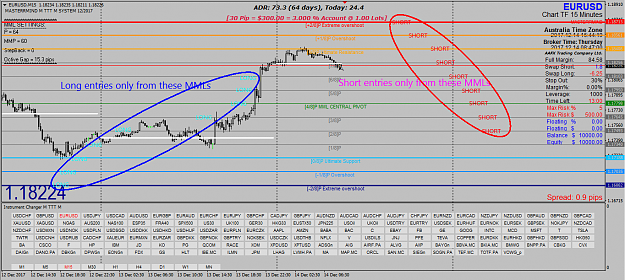
Direction of trades in a TS:
The MML System grid may be used to dictate the direction of pairs or any other defined strategic approach.
Short opportunities may be sought from the extreme upper MML zone.
Long opportunities may be sought from the extreme lower MML zone.
Pair Direction Criteria (PDC):
Ultimately PDC is at the discretion of the individual trader and the methods that they choose to apply.
I will outline some examples of how the choice of direction can be decided in a TS Order 3 setup but there are many more.
Example 1:
Lets use the current TS Order 3-#2-S3 as our first example.
TS Order 3-#2-S3
TS1, TS2 and TS3 triangulated pairings have already been chosen and I have outlined this procedure in previous posts.
TS1: EURUSD + GBPUSD = EURGBP
TS2: AUDCAD + EURCAD = EURAUD
TS3: GBPCAD + CADCHF = GBPCHF
Next step is to choose a pair direction for each of the 9 pairs (EURUSD ... GBPCHF).
a) Pair Correlation Tables (daily, weekly and monthly)
The focus was on the weekly correlation table with additional reference to both the daily and monthly correlation tables.
Starting at the top row select the maximum positive and maximum negative correlation values for all rows.
Like so,
Weekly Correlation Table (Source: myfxbook)
Attached Image (click to enlarge)
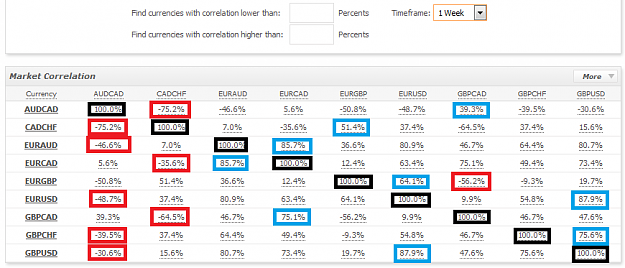
Bias is favored towards the weekly correlation table in this example due to some historical data which has shown that trades on average remain open for 44 hours (almost 2 days) in an M15 TS Order 3 setup (this trade duration time may vary over time so keep tabs on it).
Now its clear to see which pairs move in the same basic direction as other pairs and which pairs move in the opposite directions.
This information may be used to determine whether or not 2 pairs in a TS such as TS1 will be traded in the same or opposite directions.
b) MML Grid reference
The MML Grid M15 [P=64, MMP=60 and StepBack=0] of each pair is then used to find which pair from each TS group is the 'better' choice for a given direction.
The most positively correlated pair within the TS1 grouping for example, would then be traded in the opposite direction.
Similarly, this procedure is applied across all TS's so in a TS Order 3 (TS1, TS2 and TS3) we now have the directions of 6 pairs out of 9 pairs.
Like so,
TS1: EURUSD + GBPUSD = EURGBP
TS2: AUDCAD + EURCAD = EURAUD
TS3: GBPCAD + CADCHF = GBPCHF
Now we need to determine the directions of the remaining 3 pairs namely; EURGBP, AUDCAD and CADCHF.
By referring back to the correlation tables we note that EGbp more closely follows EUsd therefore we choose the long direction.
By referring back to the correlation tables we note that ACad more closely follows ECad therefore we choose the short direction.
By referring back to the correlation tables we note that CChf more closely follows GChf therefore we choose the long direction.
Note: sometimes the choice is not straightforward and when this is the case always refer to the pairs MML Grid and make the 'best' choice.
The final pair directions using this approach are as follows:
TS1: EURUSD + GBPUSD = EURGBP
TS2: AUDCAD + EURCAD = EURAUD
TS3: GBPCAD + CADCHF = GBPCHF
It is very important to realize that only a basic approach has been used here to determine pair directions within a triangulated set over a TS Order 3.
An intelligent trader would test several variations of this basic approach and attempt to apply the approach which is most likely to yield the higher strike rates.
Note: Using such an approach (or any other approach) cannot guarantee success in a trade(s) outcome in the market.
Example 2:
Another way to choose pair directions is purely selecting pairs which are currently trading in or close to the extreme MML zones.
Upper MML zone is in the range 8/8 MML to +2/8 MML in which case a short reversal entry is attempted.
Lower MML zone is in the range 0/8 MML to -2/8 MML in which case a long reversal entry is attempted.
A triangulated configuration may not be possible or is at least very difficult to achieve for every pair in a TS set and over all TS's that make up the TS Order #.
Note: Be careful of being overweight in a given currency as this may add unnecessary risk to the TS Order setup.
Example 3:
Higher Time Frame Analysis (H4 and D1)
Use higher time frame charts such as H4 or D1 using MML settings of P=64.
Pair direction may be chosen based on the price action (PA) on a HTF chart.
A long direction may be chosen after observing price bouncing off a solid level of support.
A short direction may be chosen after observing price bouncing off a solid level of resistance.
This requires paitence and continually monitoring where price is within the HTF chart in order to setup an M15 trade or series of trades.
Note: It can be frustrating searching for multiple setups which also align with the M15 chart based on TS Order size or total pair count.
Choice of Triangulated Sets:
This is at the trader’s discretion.
Some examples are shown above but there are numerous other triangulated sets that can be traded.
A comprehensive list of TS sets (groups of 3 triangulated pairs) should be readily available.
The choice can be related to a traders bias on a particular currency or set of currencies at a given point in time.
For example,
In the case of the following TS Order 3,
TS1: EURUSD + GBPUSD = EURGBP
TS2: AUDCAD + EURCAD = EURAUD
TS3: GBPCAD + CADCHF = GBPCHF
6 Currencies were used to formulate the TS Order 3 namely:
1. AUD
2. CAD
3. CHF
4. EUR
5. GBP and
6. USD
A decision might be made to NOT trade a given pair such as CAD due to its expected eratic behavior for the next several months.
Other decisions might reject a certain currency inclusion due to typical seasonal trading ranges which may impact TP levels selected.
Turtle like pairs might be rejected or volatile pairs rejected based on TS Order# risk profile.
These will be outlined in the thread in far more detail.
ACCOUNT SIZE:
Retail Trading Account funds can be categorized as follows:
Very Small < US$500
Small US$500 to US$2000
Medium US$2001 to US$10 000
Large US$10 001 to US$100 000
Very Large > US$100 000
It is recommended that trading funds of at least the Small category are used when trading the MTTTM Strategy.
If a Very Small account is to be used then it is suggested that only a TS Order 1 (3 pairs) be traded and not more until Equity reaches 'Small' status.
Large funding matched to small exposure typically equates to lower applied risk however, risk must always be actively managed.
Time Frame:
M15 or M5 is the time frame applied in the earlier part of the thread.
Higher TFs will also be traded at a later stage.
Entry:
The M15/M5 MML System template is used for taking entries.
Ideally an entry should be executed from a valid MML price line.
Entry either at an allowed MML level or after an M5 candle closes in the direction of TP.
Entries can be @ market or pending orders (Buy Stop, Sell Stop, Buy Limit or Sell Limit) depnding on the configuration of the setup.
Entries should be made as close as practicable to the relevant MML entry level.
If this is not possible then the next MML level must be used.
All entries (@ market or pending) must be placed at the same time or within 15 minutes from 1st trade to last trade.
Trade entry setup must fit within the confines of the applicable MML Grid for all trades.
The choice of SL as a function of the Octave Gap puts limitations on the entry MML level of a given trade.
For example, if SL chosen = 1*Octave Gap then the lowest possible entry for a long is at the -1/8 MML since the SL would be placed at the -2/8 MML.
If SL = 1.5*Octave Gap then the lowest possible entry for a long setup is from the 0/8 MML level, this is because entry should be taken from an MML level, the SL would be placed mid-point between -1/8 MML and -2/8 MML.
No stops or TPs can exceed the bounds of the MML Grid.
The Upper and lower bounds of the MML Grid confine the trade setup.
All trade setups playout within the relevant MML Grid at the time of planned entry (its important to re-check Octave Gap at entry time since they do update).
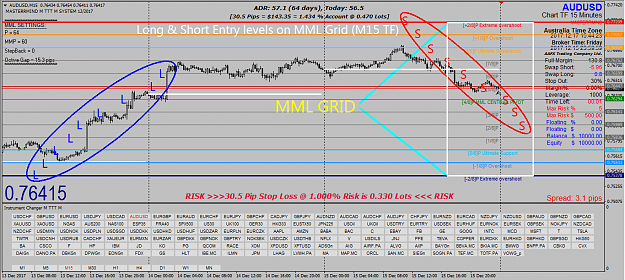
Long entries –
preferred from the lower Extreme MML zone between -2/8 MML to 0/8 MML
-2/8, -1/8, 0/8, 1/8, 2/8, 3/8, 4/8, 5/8, and 6/8 only
No longs from 7/8, 8/8, +1/8 or +2/8
Short entries-
preferred from the upper Extreme MML zone between 8/8 MML to +2/8 MML
+2/8, +1/8, 8/8, 7/8, 6/8, 5/8, 4/8, 3/8, and 2/8 only
No shorts from 1/8, 0/8, -1/8 or -2/8
Exception: the cross or single pair on 1 side of the triangulated set can trade from any MML (its purpose is to offset some of the risk)
Timing of entries into the market is determined by the trader and can be at, before or after any major open.
SL:
Hard stops always applied (no exceptions)
Minimum 1 by octave gap on an M15/M5 MML System Grid
Maximum 2 by octave gap on an M15/M5 MML System Grid
Extending out the SL also means that the TP will be moved further out so price will have further to go to reach the target.
Traders need to make a decision regarding the SL on a case by case basis.
However, from a manual trading perspective it is simpler to apply the same choice of SL design to all current trades in the same TS Order setup.
An automated system though can handle complex tasks with ease.
Additional information:
A minimum SL of 1 octave gap up to a maximum of 1.5 octave gaps (for the M15 template);
If an entry is taken from an MML level then multiples of the octave gap will produce TPs such as:
(i) 1 octave gap SL = 4 octave gap TP
(ii) 1.1 octave gap SL = 4.4 octave gap TP
(iii) 1.2 octave gap SL = 4.8 octave gap TP
(iv) 1.3 octave gap SL = 5.2 octave gap TP
(v) 1.4 octave gap SL = 5.6 octave gap TP
(vi) 1.5 octave gap SL = 6 octave gap TP and
(vii) 2 octave gap SL = 8 octave gap TP
Be aware that we trade within the MML Grid.
The MML Grid's main trading range is from the 0/8 MML through to 8/8 MML with the 2 extreme zones completing our total trading area.
If a short entry is taken from the 8/8 MML then a maximum of 2 octave gaps may be applied for the SL (TP @ 0/8 MML)
If a long entry is taken from the 0/8 MML then a maximum of 2 octave gaps may be applied for the SL (TP @ 8/8 MML)
The choice of SL in terms of the Octave Gap count therefore dictates where the TP must be placed to ensure a 4 to 1 Reward to risk ratio.
Minor modifications of the SL are possible provided the total risk across all trades in the entire TS Order setup is not exceeded.
Trailing stops are at the discretion of the trader but be fully aware that the frequency of full TPs being hit will reduce drastically so be aware how the strategies expectancy will change !
TP:
4 times the assigned SL pips to maintain the mandated 4 to 1 reward to risk ratio.
Higher TF charts such as D1, W1 or MN can be used to set TPs provided a minimum 4 to 1 R:r is maintained.
Nb. MML settings of the HTF charts should all use P=64 unless advised otherwise (there will be some exceptions).
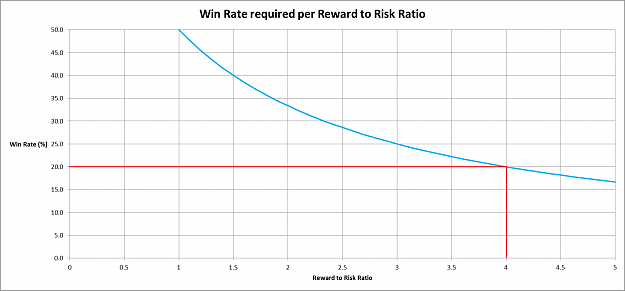
Reward to Risk ratio:
Always at least 4 to 1 for every entry taken over the entire Triangulated Set.
The following chart shows the minimum win rate to BE for a 4 to 1 reward to risk ratio.
Strategy theoretical strike rate should then be >= 20.0% (refer chart) for a 4 to 1 reward to risk ratio over the longer term.
Strategy practical strike rate should then be >= 22.2% (2/9 winners) for a 4 to 1 reward to risk ratio over the longer term.
If the strategy returns 3/10 (30%) winning trades on average over the longer term then the trading system is deemed to be profitable.
Attached Image (click to enlarge)
Attached Image (click to enlarge)
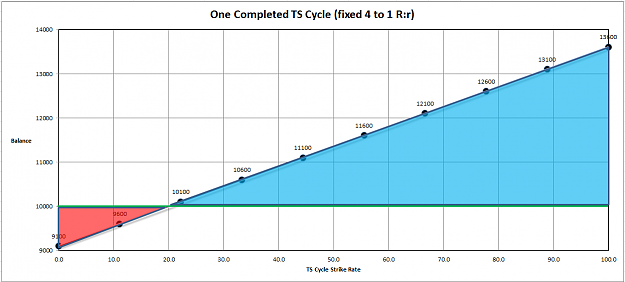
The graph above shows the various outcomes of an account of $10 000 trading a fixed reward to risk ratio of 4 to 1.
The red shaded area identifies the case for:
(a) all losing trades results in a 9% loss (for a fixed 1% risk per trade) or -$900 and a final TS Order 3 Cycle balance of $9100 and
(b) 8 losing trades results in a 4% loss (for a fixed 1% risk per trade) or -$400 and a final TS Order 3 Cycle balance of $9600
Therefore, losing 9 trades in a row produces the worst case situation which is a 9% loss to the trading account !
The blue shaded area identifies the case for:
(a) all winning trades results in a 36% gain or +$3600 and a final TS Order 3 Cycle balance of $13600
(b) 8 winning trades results in a 31% gain or +$3100 and a final TS Order 3 Cycle balance of $13100
(c) 7 winning trades results in a 26% gain or +$2600 and a final TS Order 3 Cycle balance of $12600
(d) 6 winning trades results in a 21% gain or +$2100 and a final TS Order 3 Cycle balance of $12100
(e) 5 winning trades results in a 16% gain or +$1600 and a final TS Order 3 Cycle balance of $11600
(f) 4 winning trades results in a 11% gain or +$1100 and a final TS Order 3 Cycle balance of $11100
(g) 3 winning trades results in a 6% gain or +$500 and a final TS Order 3 Cycle balance of $10500
(h) 2 winning trades results in a 1% gain or +$100 and a final TS Order 3 Cycle balance of $10100
Therefore, 2 winners out of 9 trades is all that is needed to generate a positive outcome !
Be careful about drawing any rock solid conclusions about an unfolding strategy in the live market especially if its based on a small sample size.
A small sample size may not provide any results of great significance and is mre likely to be of a random type nature.
The greater the number of trades that form part of the analysis the better (a trade count of >100-200 might be ideal with higher being better).
Note that in this method it might not always be practical to run every trade through to a full SL or full TP especially if price decides to range within the stop and TP levels for a long period of time.
Indeed it is highly likely that some trades will be closed out at less than a full stop or less than a full TP.
The trader needs to be aware of this issue and how it might affect the significance of the trading results.
Trade Management:
Set & Forget manual trading approach can be applied.
Advisable that all setups are monitored from time to time by the trader.
Minimal interference with trades is preferred.
Trader has the discretion to modify trades for potentially negative high impact news events or other key events.
Risk Management:
Maximum risk per trade is at the trader’s discretion but must consider total number of trades in the sequence over the entire trading account.
Preferably within the range 0.01% to 2% per trade.
A risk per trade in a TS Order 3 (9 pairs) should not exceed 1% since this is implying a total risk across the setup of 9%.
If higher Order TS's are traded comprised of many more pairs then risk per trade should be << 1% per pair (perhaps 0.25% to 0.5%).
Total risk across the account is the sum of all current trades SLs running in the market.
A TS Order 1 @ 1%_SL per trade would have a total risk of 3%
A TS Order 3 @ 1%_SL per trade would have a total risk of 9%
A TS Order 5 @ 1%_SL per trade would have a total risk of 15%
A TS Order 7 @ 1%_SL per trade would have a total risk of 21%
A TS Order 9 @ 1%_SL per trade would have a total risk of 27%
A TS Order 11 @ 1%_SL per trade would have a total risk of 33%
Variations in applied risk per trade may also depend on the TS being traded.
For example,
A TS Order 1 comprises 3 trades in total so a 1% risk per trade for a total risk of 3% might be acceptable.
A TS Order 3 comprises 9 trades in total so a 1% risk per trade for a total risk of 9% may not be acceptable.
For higher order TS’s it might mean reducing the risk applied per trade so that total risk is sensible.
Design a plan for the risk management part of the trading strategy:
(a) If a completed TS Order setup results in a negative gain consider reducing the risk per trade
(b) If a completed TS Order setup results in a positive gain consider increasing the risk per trade
Example of a TS Order 3 cycle
Assume current risk per trade = 1%
If TS Order 3-A (1% risk per trade * 9 trades = 9%) is a net loser ;
Then TS Order 3-B (0.8% per trade * 9 trades = 7.2%) applies only 0.8% risk per trade.
If TS Order 3-A is a net winner and TS Order 3-B is a net winner either continue at 1% risk per trade or increase risk per trade to 1.2%.
However, be very aware that this puts a total risk per TS Order 3 at 1.2%*9 trades which is a possible 13.5% loss if all trades are losers.
This type of risk is likely to be unsustainable over the longer term and possibly lead to disastrous results.
It is not advisable to keep increasing the risk per trade after a series of winning TS Order 3's since eventually a losing TS Order 3 will occur.
The trader is responsible for designing and setting the applied risk per trade but it must be sensible and realistic.
The focus should be more aligned with reducing risk on net losing TS Orders and then after positive progress slowly increase the risk back to the initial risk per trade.
As the account equity grows seek out methods that minimize the applied risk!
Risk Adjustments
Generally as account equity increases, less risk should be applied across the account in order to minimize adverse future TS Order outcomes.
However, a trader may apply at times instances of calculated risk.
An example of calculated risk for a TS Order 3:
Start Balance = 10 000
Current Balance = 12 000
Account Equity% gain is +20%
Current Risk per trade = 1% (Total Risk over 9 trades is 9%)
Next TS Order 3 risk approach
Apply Risk per trade = 1.5% (Total Risk over 9 trades is 13.5%)
Note that in theory (not accounting for negative slippage issues) even if all trades were losers (unlikely) the account start balance value is still protected.
Within a few short weeks depending on the gain in Equity and the applied risk per trade one of our key focus points is on preserving the initial capital.
An Equity Chart (end of day data) on a good trading strategy that is well managed typically shows only minimal drawdowns below initial capital level in the early stages of trading followed by no future drops in equity below initial investment.
All future drops in Equity after initial stage are typically much lower than a maximum peak to trough drop of 29% with lower being better.
If all trades were losers the account loses -13.5% of equity however, it is +20% up so a worst case scenario would still have a final balance greater than the start balance leading to preservation of funds.
There are many ways to play calculated risk but the idea should be to apply it very very sparingly (not all the time even if conditions look right) and only in situations where increased risk will not result in the account balance dropping below start balance.
If current balance drops below start balance after the completion of a TS Order# then look to reduce risk per trade.
Only apply calculated risk (sparingly) when the account equity% gain is greater than the assumed worst case risk scenario.
Additional Entries:
At the traders own discretion but current draw down or floating equity should be factored in.
Consider how the risk profile across the account may alter as trades are added.
Guideline for Optional MTTTM TS Order Strategies:
I prefer to provide a list of guidelines instead of referring to them as a set of rules.
1. Trades should run their course hitting SL or TP (Reward to Risk ratio must be 4 to 1 for every trade) except when high impact news or W/E gaps;
2. Set a %Equity gain or $ gain closure amount but avoid TPs that result in a less than 1 to 1 R:r;
3. TS's (such as M5, M15 ... HTF TS's N/A) that have run overnight and are net positive can be closed out prior to the planned next TS start time;
4. Pending orders can be deleted if they have not yet triggered same day or after a minimum 4 hours;
5. Keep the R:r constant at 4 to 1 initially.
6. After losing cycles consider reducing risk per trade, but be sure to extend the SLs out using relatively smaller lot sizing (2 parameter approach).
7. After a return to winning cycles (not single trades rather net positive gain over the entire TS Order setup) consider increasing the risk again.
8. Monitor trade stop outs and if the stop outs have reduced and the larger stops appear to be providing a larger buffer then leave the wider stops.
9. Be aware that there is a limit to how large the stops can be and typically in MTTTM this is 2 Octave Gaps and not more (4 to 1 TP !?).
10. TS Order design (same each time, selective, random, partially hedged, box-hedged, pairs at extreme MML zones, etc).
11. Consider higher TF MML Grid (HTF provides the same series of MML lines (13) but typically much larger octaves (12), forcing larger stops).
Note: Be aware of the impact to the longer term expectancy if trades are closed out early (end of week closures are one exception).
Comments:
I'll start off using a demo account and trade it manually and suggest other traders do likewise.
Fundamental analysis is limited in this trading strategy in the lower TFs but should be considered in the HTFs.
Mostly a mechanical technical approach.
The initial setup for the Triangulated Sets is what will be the most time consuming exercise (Lot_Size-MTTTM indicator now posted) but with practise all things become faster and easier.
SLs will then need to be allocated noting that on an MML Grid not all pairs exhibit the same octave gap and a given pairs pip value also differs from other pairs.
Since the octave gap may differ and the pair choice may differ then the pips assigned to a given trade may also vary.
Therefore lot sizes allocated to a given pair will also differ even though risk per trade is the same for all entries of the same TS Order Set.
Take note of the following formulas as they will need to be applied for every pair traded.
Lot size = $Risk per Trade / [Octave Gap * Pair pip value per lot] ... consider any Octave Gap multiplier being used
$Risk per Trade is calculated based on trader assigned risk% per trade eg 0.01%, 0.1%, 1% or 2%
Example applying a 1% risk per trade on a 10 000 balance is as follows:
Account Balance = 10 000
Risk per trade (trader assigned) = 1% = 1/100*10 000 = 100
Assume Pair = EURUSD
Assume Octave Gap = 25 pips
Lot size for EURUSD = $Risk per Trade / [Octave Gap*Pair pip value per lot] = 100/(25*10) = 0.4 lots.
Check 0.4 lot value by using Lot size * Pip value per lot * Octave Gap
[it should equal $Risk per trade … and in this case it does = 100 = 1% risk of 10 000].
=================================================================================
INDICATORS AND TEMPLATES SECTION!
=================================================================================
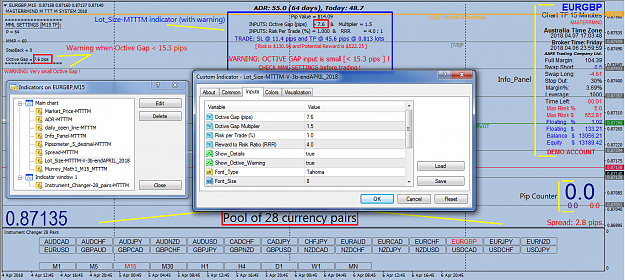
MT4 TOOLS (being phased out over the next several months):
Lot-Size-MTTTM indicator & Instrument_Changer-28_pairs-MTTTM indicator
Attached Image (click to enlarge)
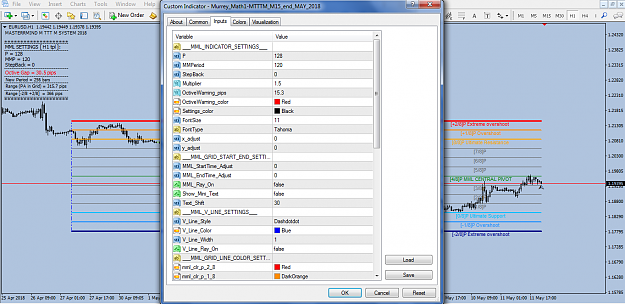
Murrey_Math1-MTTTM_M15 indicator
Attached Image (click to enlarge)
MML-Fibonacci indicator ... coming soon !
Attached Image (click to enlarge)
MT4 TOOLS Zip Folder
Attached File(s)
Note 1: Some indicators contain an expiry date but may be extended subject to thread participation.
Note 2: To use the MML-Fibonacci indicator follow the instructions located in the 'About' tab.
MT5 TOOLS:
All indicators and templates will soon be switched over to MT5 !
MT5 TOOLS Zip Folder ..... Coming soon !
Note that as soon as the current MT4 demo test runs have been completed there will be a move to MT5 !
=================================================================================
So if trading 3 triangulated sets there will be 9 calculations involved (1 per trade over 9 trades).
Always double check the calculations to ensure an identical risk profile is applied throughout.
When trades are applied use your mouse to ‘mouse over’ the SL lines to check they are correct.
The idea of the MTTTM methodology is to simply allow all trades time to play out.
As cycles of trades in TS's complete it is important to evaluate the trading data and seek out ways to improve the strike rate.
There will be winners and there will be losers.
The win/loss ratio can be rather unimpressive but this is not a concern since the strategy relies on a limited number of winning trades to generate a net gain and this translates into account growth over the longer term.
Consider TS Order 1 (3 trades) @ 1% Risk per Trade
1 losing trade (L) = -1%
1 winning trade (W) = +4%
3 losses= 3*(-1%) = -3%
2L + 1W = 2*(-1%) + 1*(4%) = +2%
3W = 3*(4%) = +12%
Only 1 winner needed to be net positive (+2% gain) even though you lost 2 trades.
As an exercise run through a TS Order 3, then 5, then 7 etc.
A TS Order 3 @ 1%SL has a range [-9% to +36%].
Recall that a TS Order 3 is a set of 9 trades.
Not very likely you will get 9/9 winners is it … although possible.
Look at it in terms of the minimum winners required to be net positive.
2 winners out of 9 trades is needed to be net positive 1%.
3 winners out of 9 trades is needed to be net positive 6%.
4 winners out of 9 trades is needed to be net positive 11%.
And yet 2,3 or 4 winners out of 9 trades is still less than a 50% strike rate !
Small accounts might be better to trade only 1 triangulated setup of 3 pairs (TS Order 1) until the account grows much larger in equity.
Larger accounts may trade any Order Triangulated Sets within reason such as:
1 Triangulated Set = 3 pairs
3 Triangulated Sets = 9 pairs
5 Triangulated Sets = 15 pairs
7 Triangulated Sets = 21 pairs
9 Triangulated Sets = 27 pairs
11 Triangulated Sets = 33 pairs
3 Triangulated Sets (9 trades) in a TS Order 3 should be the limit until full confidence in the system is gained and it makes sense to do so.
*****************************************************************************************
ADVANCED TRADE MANAGEMENT CONCEPTS
1. Equity Curve Trace Management (ECTM)
2. Dynamic Feed Approach (DFA)
3. MATLAB (analysis engines and code)
4. Python code (Pandas backtest with Zipline and Quantopian; Quant Platforms and Python for Algorithmic Trading)
5. Java code
These concepts may be outlined subject to reasonable thread participation.
Note: The MTTTM Strategy is provided here in a "raw" form and it is up to the trader to advance and refine the techniques.
*****************************************************************************************
MYFXBOOK Links:
MTTTM-Test 1
https://www.myfxbook.com/members/MAS...-ttt-m/2359306
MTTTM-Test 2-Lev25
https://www.myfxbook.com/members/MAS...-lev25/2628451
MTTTM-Live-1K
..... pending participation ......
Important:
Test the M TTT M methodology using a demo account in the first place.
If trading on a live account be aware of the risks involved.
The method relies on gaining only a few profitable trades from a group to generate net gain.
After a grand cycle of Triangulated trades have completed, evaluate the results, adjust for improvements and repeat the process.
Consider the additional risks involved with opening a TS Setup on a Friday and the likely impact of an unfavorable weekend gap.
Its meant to be a very simple system provided the risk profile is adhered too.
However, the MTTTM strategy can become highly complex very very quickly.
For advanced versions and higher Order TS setups a trade management or expert advisor is highly recommended.
It is possible that a series of MT5 tools may become available in the future as an assistant to the trader.
Remember that the trader is ultimately responsible for supervising the entire process and not the tools being applied.
Test it out and post your experiences on the thread !
ALWAYS MANAGE THE RISK !
MASTERRMIND .............
Master your Mind then Master your Trades