Hello,
I am still testing this strategy and would welcome some feedback from more experienced traders please?
My strategy has the following components:
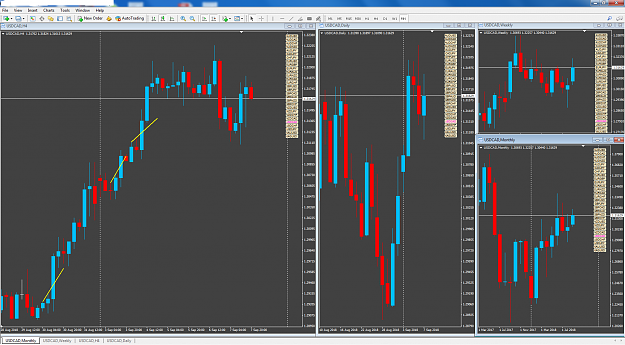
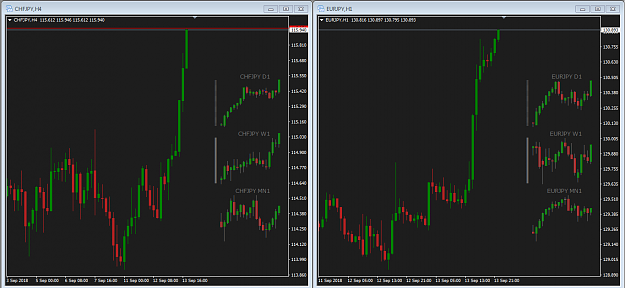
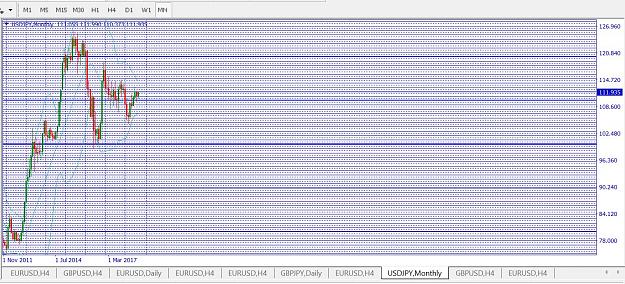
Monthly chart with red & blue candles.
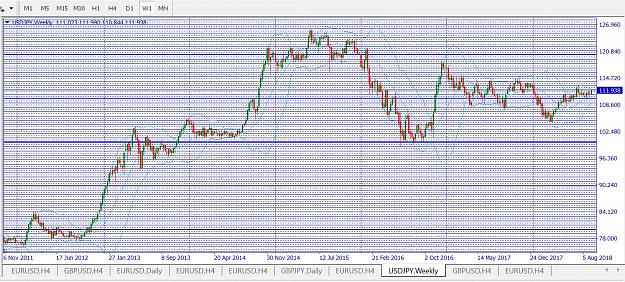
Weekly chart with red & blue candles.
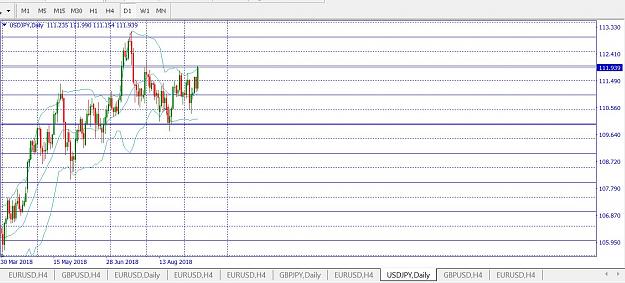
Daily chart with red & blue candles.
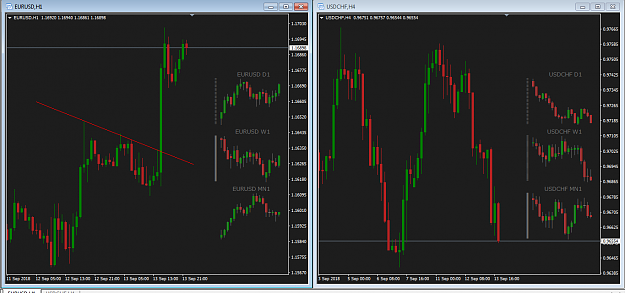
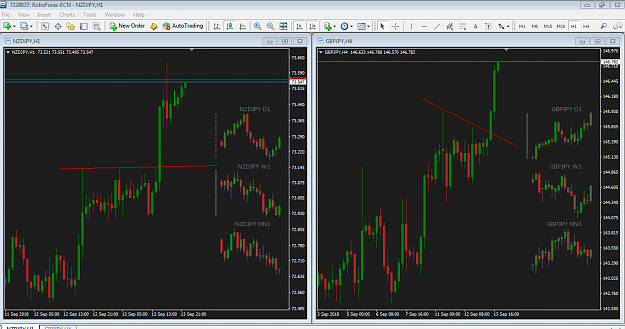
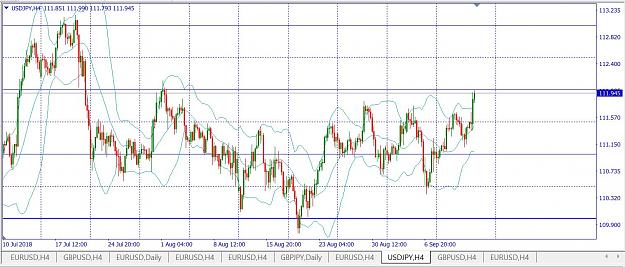
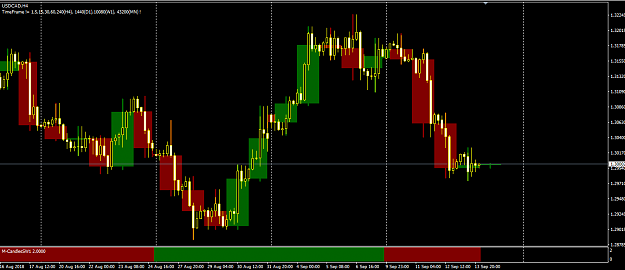
4 Hour chart with red & blue candles and this is the only chart which I trade from.
I swap easily between currency pairs by using the yellow buttons.
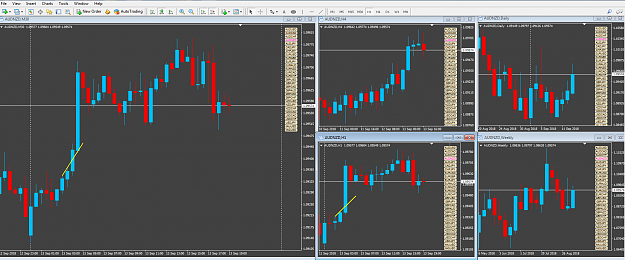
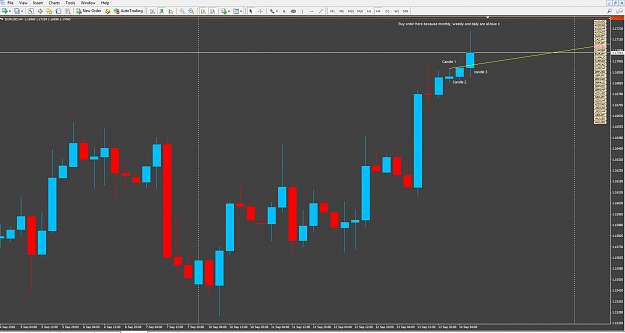
4 hour chart BUY setups to trade.
If the monthly, weekly and daily chart candles are all BLUE candles:
On the 4 hour chart, a red or blue candle will make a high, if the very next candle makes a higher high, then I draw a line from the first candles high to the second candles high. If the very next candle closes above the line, I enter a buy order trade 20 pips above the third candles high.
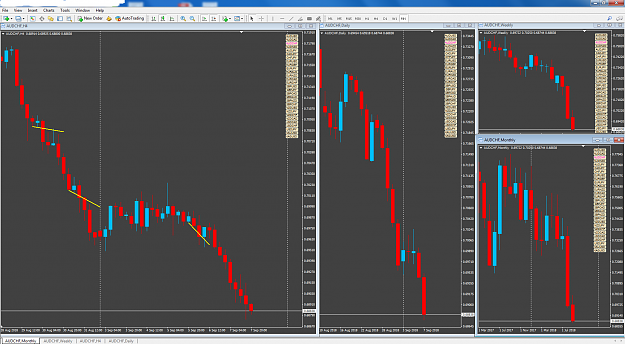
4 hour chart SELL setups to trade.
If the monthly, weekly and daily chart candles are all RED candles:
On the 4 hour chart, a red or blue candle will make a low, if the very next candle makes a lower low, then I draw a line from the first candles low to the second candles low. If the very next candle closes below the line, I enter a sell order trade 20 pips below the third candles low.
Thank you
Scchplendid
I am still testing this strategy and would welcome some feedback from more experienced traders please?
My strategy has the following components:
Monthly chart with red & blue candles.
Weekly chart with red & blue candles.
Daily chart with red & blue candles.
4 Hour chart with red & blue candles and this is the only chart which I trade from.
I swap easily between currency pairs by using the yellow buttons.
4 hour chart BUY setups to trade.
If the monthly, weekly and daily chart candles are all BLUE candles:
On the 4 hour chart, a red or blue candle will make a high, if the very next candle makes a higher high, then I draw a line from the first candles high to the second candles high. If the very next candle closes above the line, I enter a buy order trade 20 pips above the third candles high.
4 hour chart SELL setups to trade.
If the monthly, weekly and daily chart candles are all RED candles:
On the 4 hour chart, a red or blue candle will make a low, if the very next candle makes a lower low, then I draw a line from the first candles low to the second candles low. If the very next candle closes below the line, I enter a sell order trade 20 pips below the third candles low.
Thank you
Scchplendid
Attached Image(s) (click to enlarge)