This thread will be using the "4 TF Heiken Ashi arrows" indicator.
This will work on TFs 1hr and up, it will work on lower TFs but spread will kill you.
The entry will be on a closed candle with an arrow.
This indicator does not repaint, in as so much as it will not set arrows in stone, on the lower TFs if the HTFs are still fluctuating between the different HH candle colours.
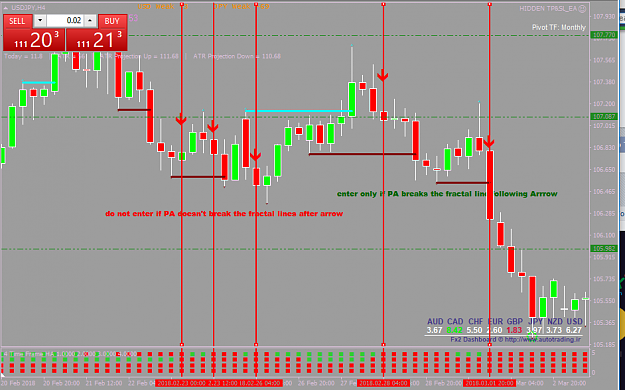
So, as an example if the lowest TF is H4 then the highest TF is monthly. As such if you have a an established bull candle on, say, daily and weekly but the monthly is still undecided then you will have a bullish arrow on H4 only while the monthly candle is bullish. If it turns back to bearish, during it's month long forming, the candle on H4 will disappear.
Now I have done a visual backtest on EURUSD since the start of March 2018 till present, on 4hr TF. I will be forward testing starting Sunday August, 5 2018.
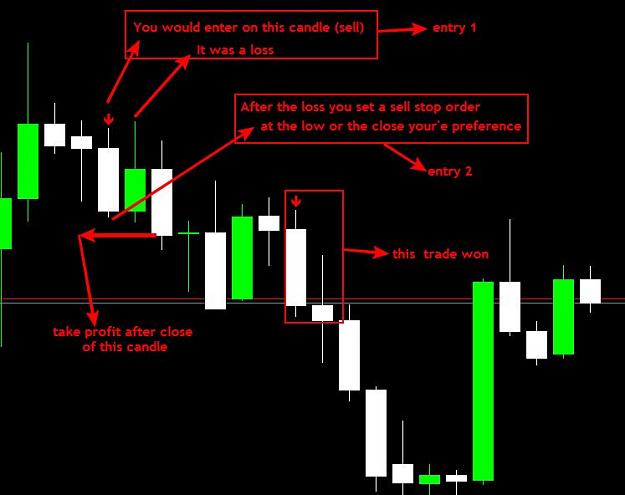
I have used 2 types of entry...first was after a candle closes with an arrow on your current TF (lowest TF) you enter a trade in the direction of the arrow and close after the next candle, be it win or loss.
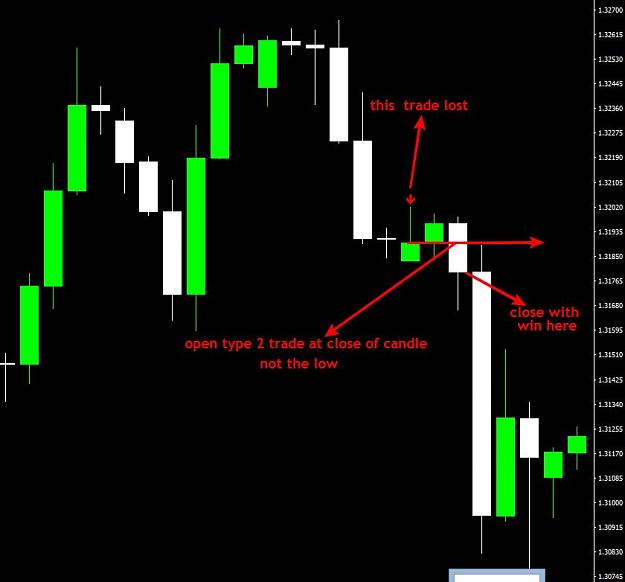
Second type of entry (preferred) will be to set a pending order at the open of the signal candle (the one with the arrow) and close the trade when a candle closes above/below our entry price.
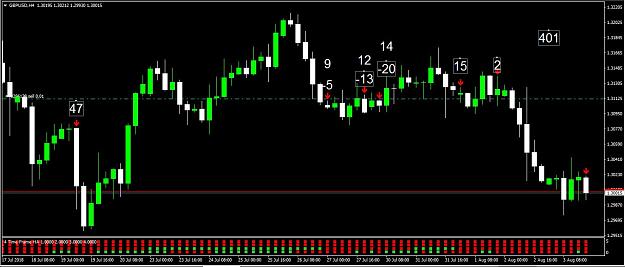
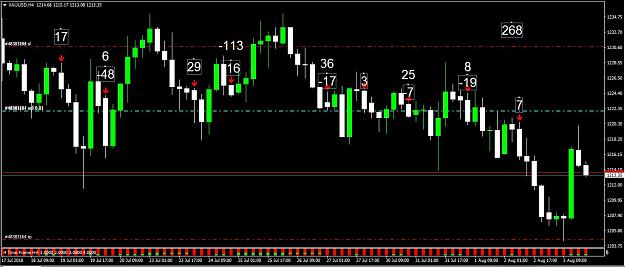
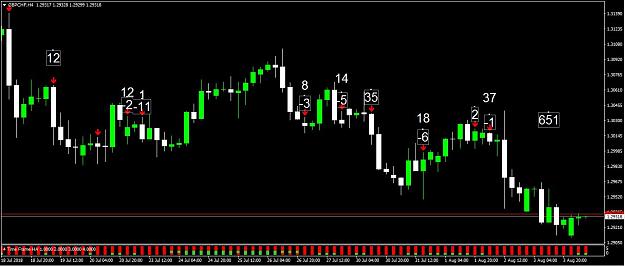
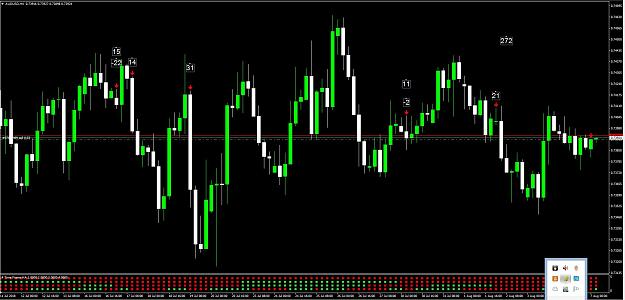
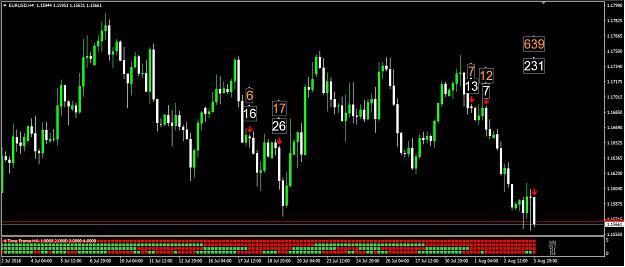
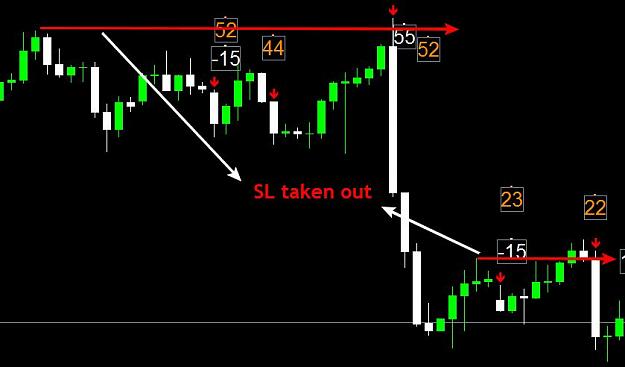
The chart below shows the last few trades taken (white is entry 1 and orange is entry 2) the large numbers are the results since March 1 2018.
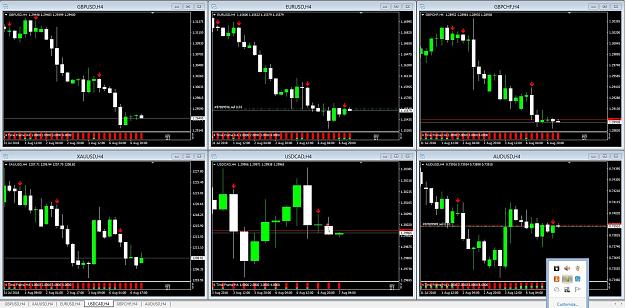
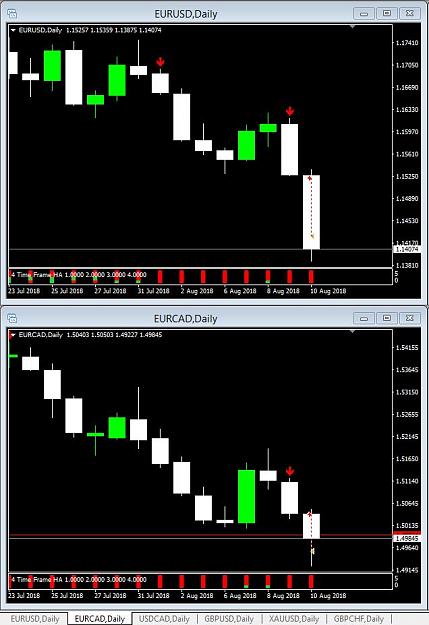
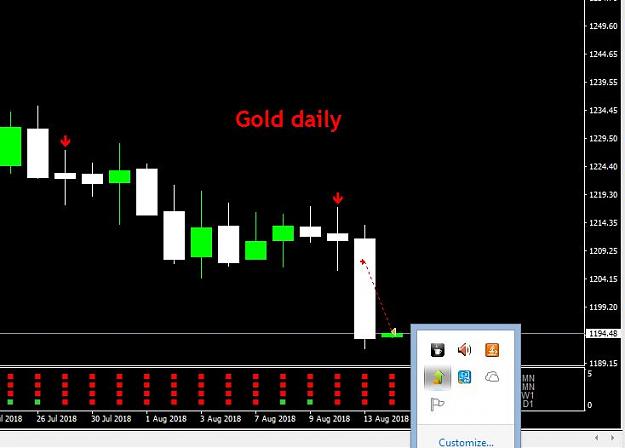
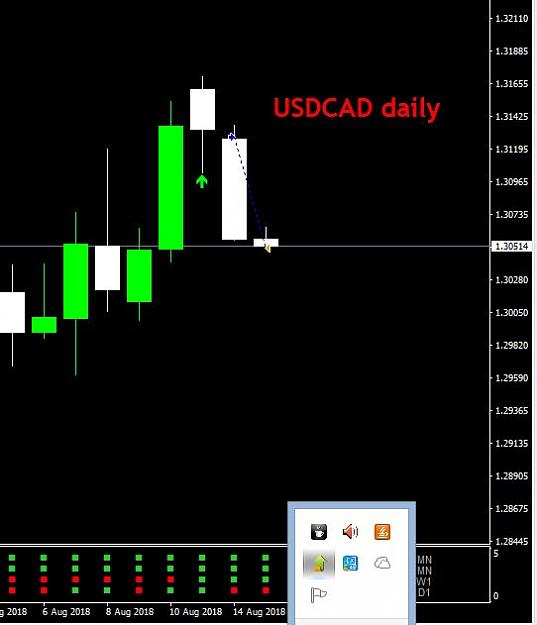
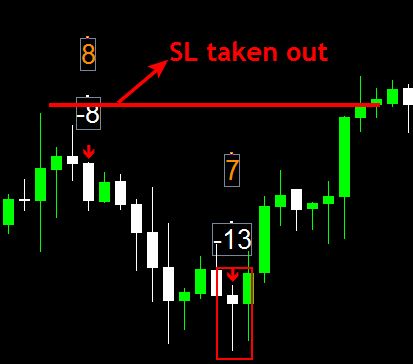
Please note no SLs were placed on any of these trades, if you wanted to place a SL at the most recent high/low you would have had only a few instances where they were hit. See last two pictures. This affects only type 2 entries.
Chris
PS; If you see any reason why this will not work let me know. All results are in pips not points.
This will work on TFs 1hr and up, it will work on lower TFs but spread will kill you.
The entry will be on a closed candle with an arrow.
This indicator does not repaint, in as so much as it will not set arrows in stone, on the lower TFs if the HTFs are still fluctuating between the different HH candle colours.
So, as an example if the lowest TF is H4 then the highest TF is monthly. As such if you have a an established bull candle on, say, daily and weekly but the monthly is still undecided then you will have a bullish arrow on H4 only while the monthly candle is bullish. If it turns back to bearish, during it's month long forming, the candle on H4 will disappear.
Now I have done a visual backtest on EURUSD since the start of March 2018 till present, on 4hr TF. I will be forward testing starting Sunday August, 5 2018.
I have used 2 types of entry...first was after a candle closes with an arrow on your current TF (lowest TF) you enter a trade in the direction of the arrow and close after the next candle, be it win or loss.
Second type of entry (preferred) will be to set a pending order at the open of the signal candle (the one with the arrow) and close the trade when a candle closes above/below our entry price.
The chart below shows the last few trades taken (white is entry 1 and orange is entry 2) the large numbers are the results since March 1 2018.
Please note no SLs were placed on any of these trades, if you wanted to place a SL at the most recent high/low you would have had only a few instances where they were hit. See last two pictures. This affects only type 2 entries.
Chris
PS; If you see any reason why this will not work let me know. All results are in pips not points.
Attached Image (click to enlarge)
Attached Image (click to enlarge)
Attached Image
Attached File(s)
Attached File(s)