******************************************EDIT*************************************************
STRATEGY:
I trade the 1h and 4h charts only, feel free to try any other timeframe, but for me at least it is not worth it.
The ultimate trading advice everybody knows is: NEVER TRADE AGAINS THE TREND. But how to define and choose which trend you want to follow and catch?
Well there it goes:
I AM USING INDICATORS:
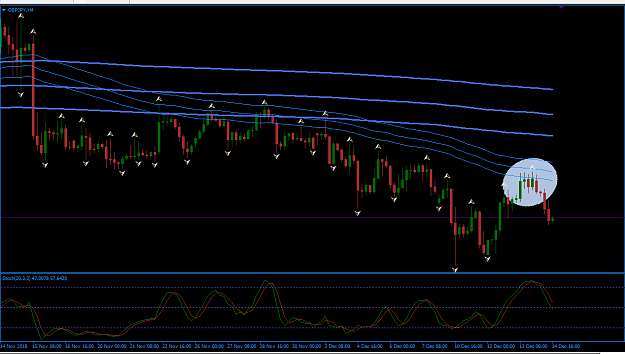
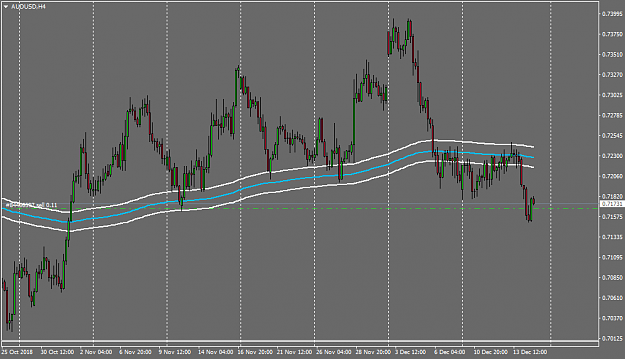
- EMA 50 APPLYED TO CLOSE, HIGH, AND LOW
- STOCHASTIC OSCILATOR 10 3 3, simple and close/close
overbough at 80 and oversold at 20
RULES:
- BUYS:
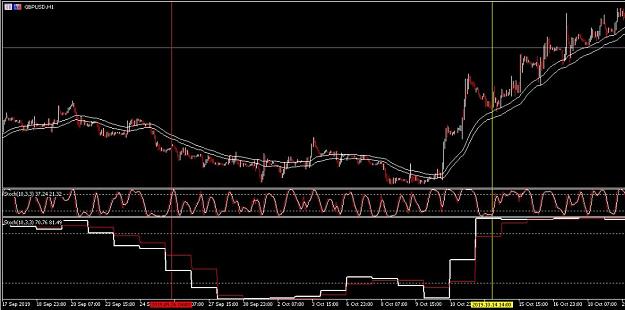
* If trading the 1h chart, both the 1h and 4h timeframes MUST BE OVER the 50 emas. If daily also is? GREAT!
* If trading the 4h chart, both the 4h and the daily MUST BE OVER the 50 emas. If weekly also is? GREAT!
- Sell:
* If trading the 1h chart, both the 1h and 4h timeframes MUST BE UNDER the 50 emas. If daily also is? GREAT!
* If trading the 4h chart, both the 4h and the daily MUST BE UNDER the 50 emas. If weekly also is? GREAT!
ENTRIES
Needless to say that all trends make HH and HL (bullish) and LL and LH (bearish).
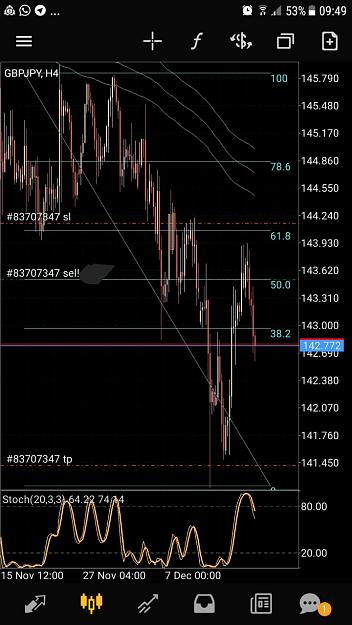
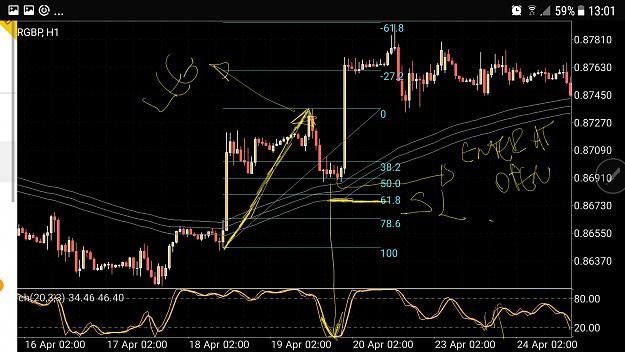
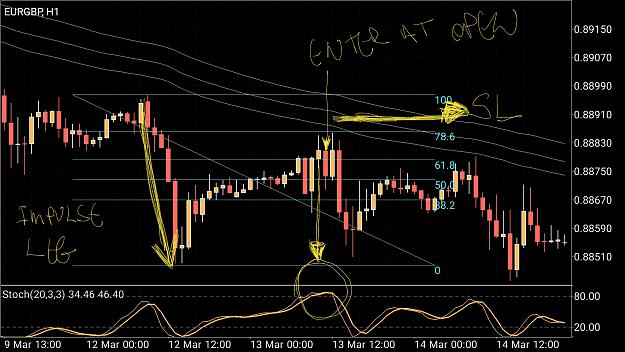
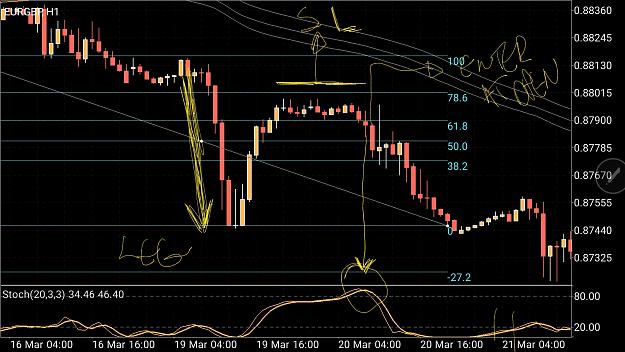
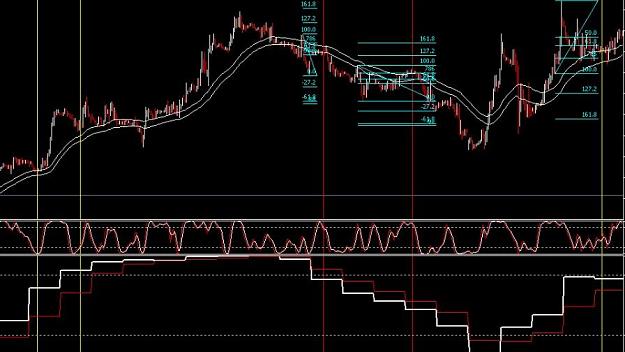
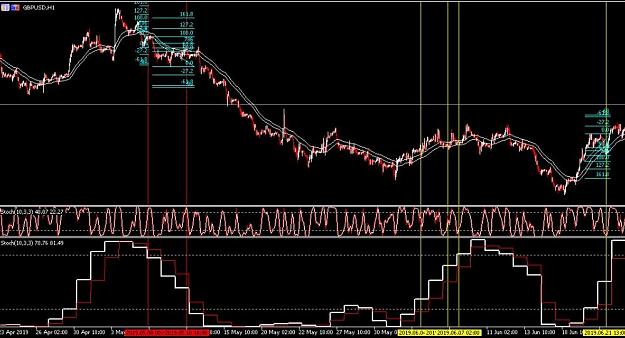
- When spoting the stochastic entering the overbought or oversold area, look for the current swing leg and draw the fibonacci retracement.
- My sweet spots are the 61.8 and 78.6 fib retracements. IF IT PASSES THESE ZONES MY ENTRY IS OVER!
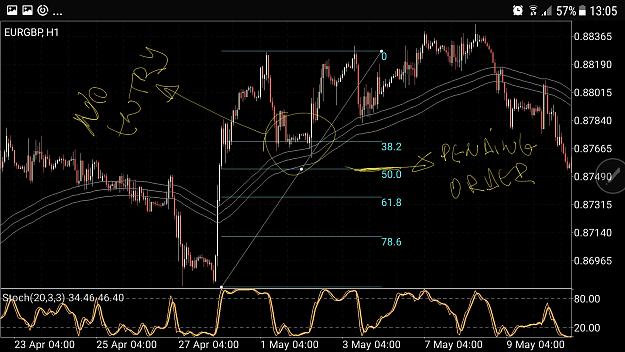
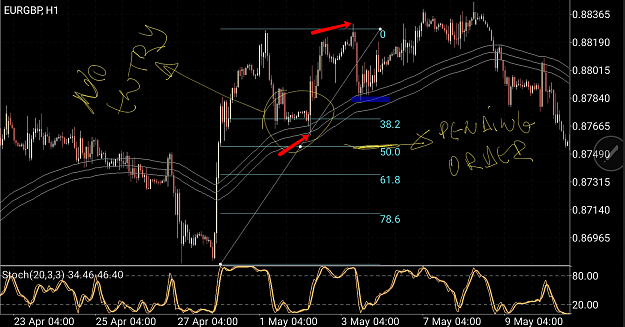
- Once a candle is closed and it makes the stochastic lines touch or become "SUPER CLOSE" INSIDE the overbought or oversold area we open a position at the open of the next candle. The safest is waiting for stoch to cross after candle close;
- If all the above criteria are met but the pullback haven't reached at least the 61.8fib retracement you can wait a tap at it before entering, unless you have a good motive to get in before the "sweet spots".
SL and TP
- Put the SL on the nex fib area toched by the candles +10pips, Since my sweet spots are the 61.8 and 78.6 fib retracement usually my SL are above/below the last fib zone.
- TP is at -27 of the leg, so you have to adjust your fib configurations
TRADE MANAGEMENT
- Move to breakeven once it has reached the same amount of pips as your sl.
MARKET CONTEXT FOR ENTRIES
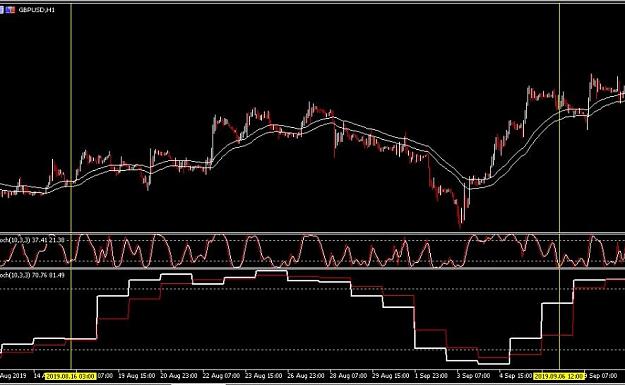
I've noticed that stochastic in the overbough/oversold zones at Daily and Weekly charts most often sinalizes acumulations on a lower tf, in forex market trends can happen but usually for a small period of time in hfts compared of course with stocks, so my bactesting considered taking 1h pullbacks when daily stochastic was moving from zone to zone, or 4h pullbacks when weekly stochastic were moving from zone to zone
I stop trading when both lines for the daily/weekly stochs reach the overbought/sold zone!
PLEASE DOWNLOAD THE MULTI TIMEFRAME STOCHASTIC INDICATOR AVAILABLE IN THIS THREAD.
TELEGRAM:
https://t.me/WDfxPullback
*Please note that the only thing that may cause confusion is from which swing low or high to draw the fib retracement,the rule for this is simple, the fib must be placed from (bearish leg) Green candle till the next green candle down, and the oposite for long positions.
*Please i'm just sharing what is working greatly for me, as i shared with my friends, i have no intentions to compare or claim that i'm better then no one or have made a better system to any other.
*Please note that im not fluent in english, and please NO DISRESPECT TO OTHERS in this thread. Cheers
STRATEGY:
I trade the 1h and 4h charts only, feel free to try any other timeframe, but for me at least it is not worth it.
The ultimate trading advice everybody knows is: NEVER TRADE AGAINS THE TREND. But how to define and choose which trend you want to follow and catch?
Well there it goes:
I AM USING INDICATORS:
- EMA 50 APPLYED TO CLOSE, HIGH, AND LOW
- STOCHASTIC OSCILATOR 10 3 3, simple and close/close
overbough at 80 and oversold at 20
RULES:
- BUYS:
* If trading the 1h chart, both the 1h and 4h timeframes MUST BE OVER the 50 emas. If daily also is? GREAT!
* If trading the 4h chart, both the 4h and the daily MUST BE OVER the 50 emas. If weekly also is? GREAT!
- Sell:
* If trading the 1h chart, both the 1h and 4h timeframes MUST BE UNDER the 50 emas. If daily also is? GREAT!
* If trading the 4h chart, both the 4h and the daily MUST BE UNDER the 50 emas. If weekly also is? GREAT!
ENTRIES
Needless to say that all trends make HH and HL (bullish) and LL and LH (bearish).
- When spoting the stochastic entering the overbought or oversold area, look for the current swing leg and draw the fibonacci retracement.
- My sweet spots are the 61.8 and 78.6 fib retracements. IF IT PASSES THESE ZONES MY ENTRY IS OVER!
- Once a candle is closed and it makes the stochastic lines touch or become "SUPER CLOSE" INSIDE the overbought or oversold area we open a position at the open of the next candle. The safest is waiting for stoch to cross after candle close;
- If all the above criteria are met but the pullback haven't reached at least the 61.8fib retracement you can wait a tap at it before entering, unless you have a good motive to get in before the "sweet spots".
SL and TP
- Put the SL on the nex fib area toched by the candles +10pips, Since my sweet spots are the 61.8 and 78.6 fib retracement usually my SL are above/below the last fib zone.
- TP is at -27 of the leg, so you have to adjust your fib configurations
TRADE MANAGEMENT
- Move to breakeven once it has reached the same amount of pips as your sl.
MARKET CONTEXT FOR ENTRIES
I've noticed that stochastic in the overbough/oversold zones at Daily and Weekly charts most often sinalizes acumulations on a lower tf, in forex market trends can happen but usually for a small period of time in hfts compared of course with stocks, so my bactesting considered taking 1h pullbacks when daily stochastic was moving from zone to zone, or 4h pullbacks when weekly stochastic were moving from zone to zone
I stop trading when both lines for the daily/weekly stochs reach the overbought/sold zone!
PLEASE DOWNLOAD THE MULTI TIMEFRAME STOCHASTIC INDICATOR AVAILABLE IN THIS THREAD.
TELEGRAM:
https://t.me/WDfxPullback
*Please note that the only thing that may cause confusion is from which swing low or high to draw the fib retracement,the rule for this is simple, the fib must be placed from (bearish leg) Green candle till the next green candle down, and the oposite for long positions.
*Please i'm just sharing what is working greatly for me, as i shared with my friends, i have no intentions to compare or claim that i'm better then no one or have made a better system to any other.
*Please note that im not fluent in english, and please NO DISRESPECT TO OTHERS in this thread. Cheers
Attached Image(s) (click to enlarge)
Attached File(s)