Hi All,
I just want to thank everyone so far for all their help and feedback, this forum and all its members are fantastic.
Ok I will get right to it: I have attached an example of what I will try to explain below and am looking for imput or criticism or whatever on this method as it ONLY uses trendlines.
So what I have been trying for a short period of time is choosing entry points on the live date only if the following occurs:
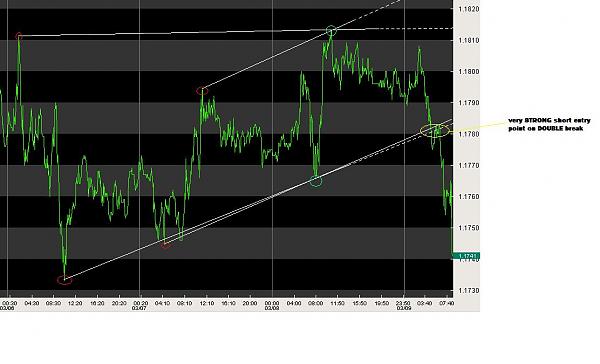
5day chart, today being the 9th- I would take a trendline high from the 6th runninng into the trendline high on the 8th continuing the line into the LIVE date the 9th. I would do the same with the trendline low from the 6th into the low on the 8th continuing the line into live date the 9th. I would replicate this using the 7th also same as above and ALSO hitting through the 8th with line continuing into the live on the 9th.
So essentially 2 trendlines-using previous to live always as key point. Should BOTH trendlines cross an entry point short or long I would enter the position.
Should both trendlines show and entry point the size of your thumb or smaller its an excellent entry point. In this instance shown in the attached example
it was a !! STRONG entry Short which I did at 1.1784 with a limit at 1.1745 and a stop at 1.18.
I hit my mark and took my gains very happily.
Now I have had great success using this method, however have not yet used it for the duration of a full month.
I have had some feedback thus far saying to use this as indicators only and rely more on support and resistance lines rather than trendlines. Although when I first was doing this i was using only 1 to 1 trendline now am using 2:1 and in some instances 3:1 if I am unsure.
Any feedback or imput at all would be Greatly appreciated
Thanks
I just want to thank everyone so far for all their help and feedback, this forum and all its members are fantastic.
Ok I will get right to it: I have attached an example of what I will try to explain below and am looking for imput or criticism or whatever on this method as it ONLY uses trendlines.
So what I have been trying for a short period of time is choosing entry points on the live date only if the following occurs:
5day chart, today being the 9th- I would take a trendline high from the 6th runninng into the trendline high on the 8th continuing the line into the LIVE date the 9th. I would do the same with the trendline low from the 6th into the low on the 8th continuing the line into live date the 9th. I would replicate this using the 7th also same as above and ALSO hitting through the 8th with line continuing into the live on the 9th.
So essentially 2 trendlines-using previous to live always as key point. Should BOTH trendlines cross an entry point short or long I would enter the position.
Should both trendlines show and entry point the size of your thumb or smaller its an excellent entry point. In this instance shown in the attached example
it was a !! STRONG entry Short which I did at 1.1784 with a limit at 1.1745 and a stop at 1.18.
I hit my mark and took my gains very happily.
Now I have had great success using this method, however have not yet used it for the duration of a full month.
I have had some feedback thus far saying to use this as indicators only and rely more on support and resistance lines rather than trendlines. Although when I first was doing this i was using only 1 to 1 trendline now am using 2:1 and in some instances 3:1 if I am unsure.
Any feedback or imput at all would be Greatly appreciated
Thanks
Attached Image