Hi there Bob, This looks like an interesting strategy by the look of things. Just several technicalities that I may want to clarify and learn further. 1. For the Hi Lo Spread Indicator, I get that the high and low refers tot he current candlestick, but how does D1 and average is calculated and its significance. And also what made you come up with the stop loss of dividing by 3? 2. For the MA MTF, do we have to wait for all the arrows to turn in our favour? 3. For entry, and besides scalping as you have mentioned in your starting post, for the crossover...
Ignored
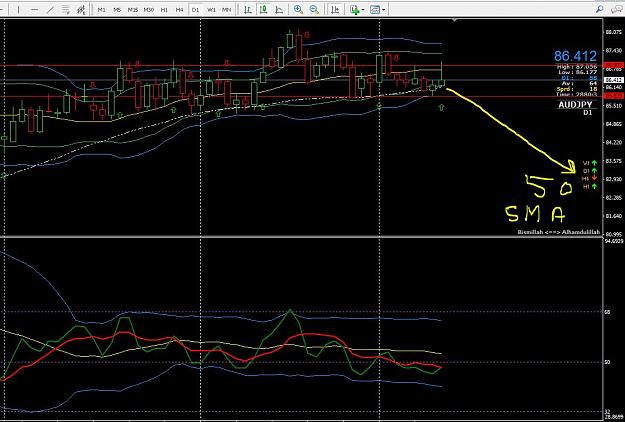
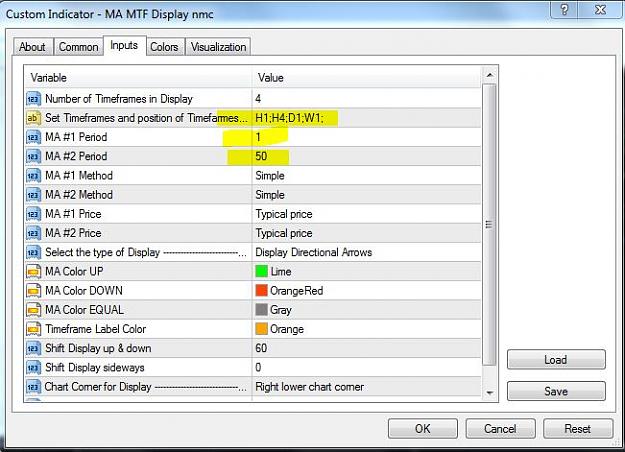
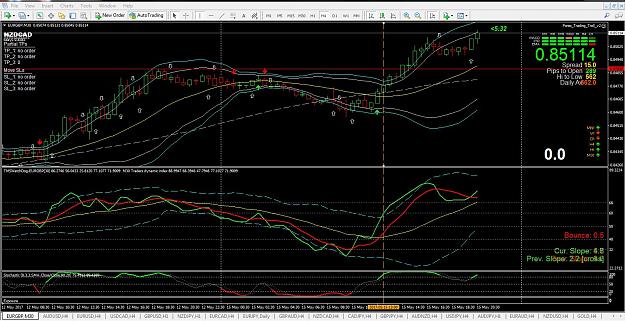
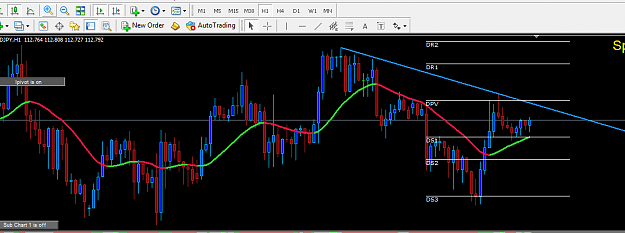
High Low is the day movement so is D1 IS DAY MOVEMENT SO FAR
Stop loss CAN BE DIVIDE BY THREE or four
Ma Mft . only pay attension to 1. Hr 4Hr D1 Wi this just confirms thst the trend on the TFs is going in the same direction.
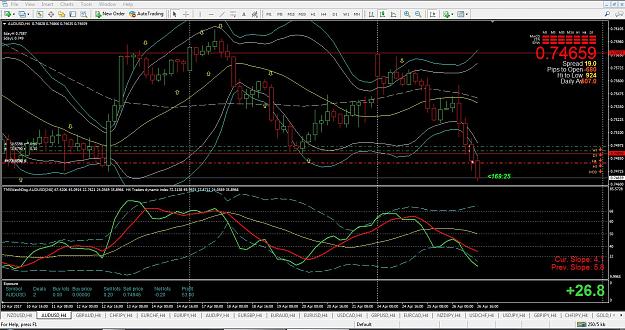
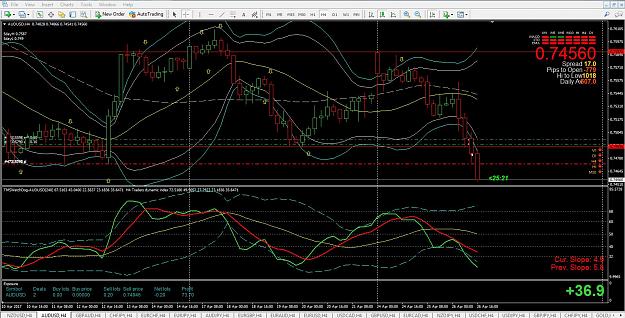
The yelow line is the price base line , not only do you wait for it to cross make sure that the slope is pointing in the same direction of the trend even if it is only slight , just put the cross hairs over it and you can easily see .. Dont have the TDI indicator too small as you cannot pick out the details. With my eyes I need it. Bob
HI there Bob, Nice system, I've been reading and im a little mixed up... do we take the indicator on post 1 with their setting or do we take the one's on post #38 with their settings? On post 1 you specify scalping... active... moderate... what is active and moderate... what does it mean. And are there more entry rules? Please specify.
Ignored
Take the latest I sometimes have problems explaining.
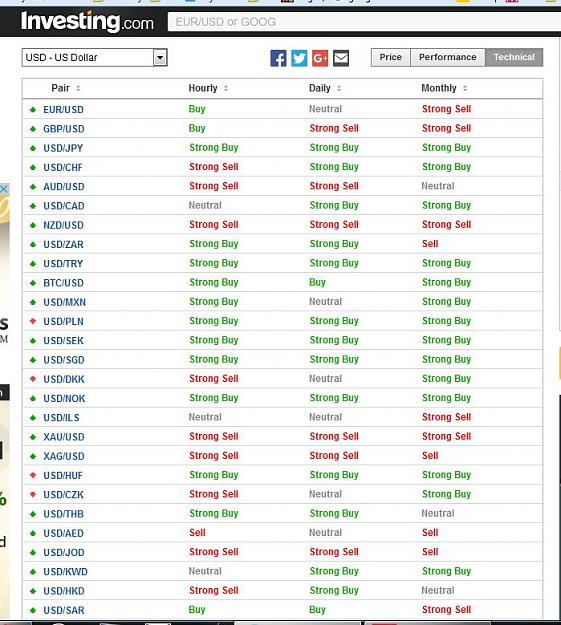
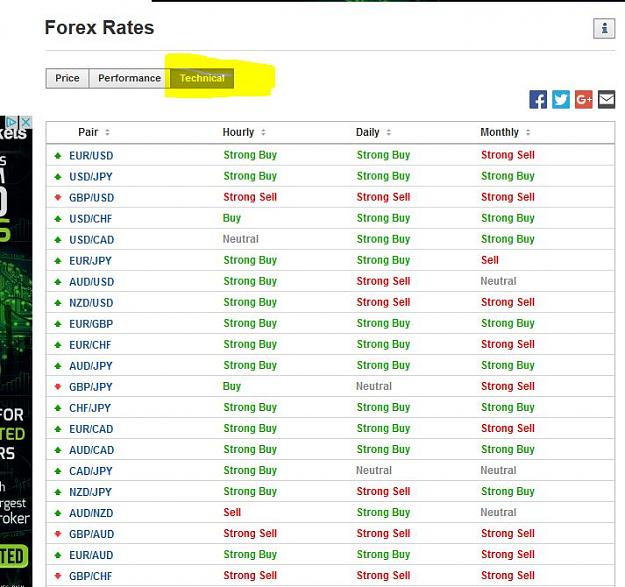
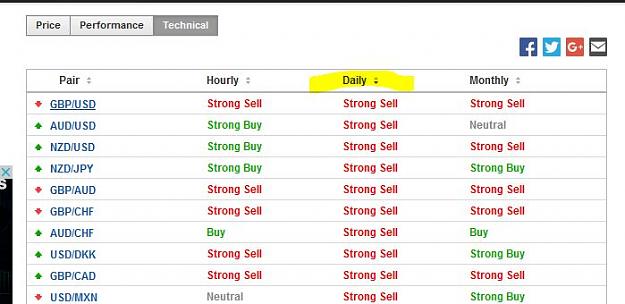
{quote} If you go to the web page.select from the top bar . Forex Majors Forex rates menu select Technical {image} select Daily {image} this will tell you at a glance what the pairs are doing, Plus if you browse the pages it will tell you the performance of ALL currencies.
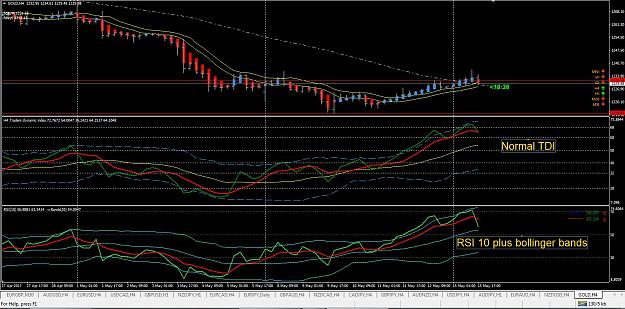
{quote} Bollinger bands are designed from standard deviation calculations, or what you might remember as a bell curve, and are predictive in nature. Deviation 1 predicts where 68.27% of price data points will be, while deviation 2 predicts 95.45% of price data points and deviation 3 predicts 99.7%. Price data points are each tick that is drawn as part of the moving tip of your candle or bar on a X-Y axis of Time/Price. It appears the OP is using two different values for the chart Bollinger band. If the TDI has not been altered, the bband for it...
Ignored
The relation between the TDI and the bollinger band. The tdi volatility band is a bollinger stuck onto an rsi see below
Attached Image (click to enlarge)
so if you have th BB on the main chart and the volatility band with the same deviation no diference. plus the PBL is the center line on the BB
what does this mean, you would not open a buy trade with the price below the BB centre line , the same applies to the TDI PBL
Perhaps I was too technical. It is a Bollinger band, but it is set to 1.6185 deviations. I prefer this value to be 1.0. That is what I meant to say. int start() { double MA,RSI[]; ArrayResize(RSI,Volatility_Band); int counted_bars=IndicatorCounted(); int limit = Bars-counted_bars-1; for(int i=limit; i>=0; i--) { RSIBuf = (iRSI(NULL,0,RSI_Period,RSI_Price,i)); MA = 0; for(int x=i; x<i+Volatility_Band; x++) { RSI[x-i] = RSIBuf[x]; MA += RSIBuf[x]/Volatility_Band; } UpZone = (MA + (1.6185 * StDev(RSI,Volatility_Band))); DnZone = (MA - (1.6185...
Ignored
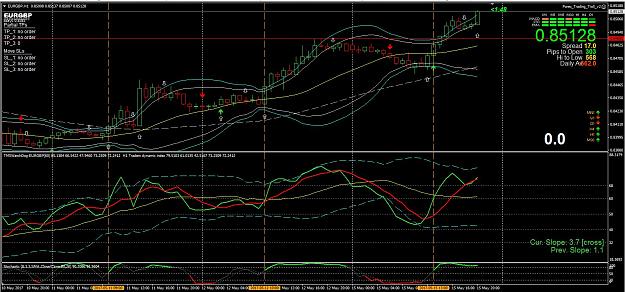
I set on the main chart BB 20 dev 2 and the grey inner BB 20 dev 1.5
We both have the same logic just slightly different settings
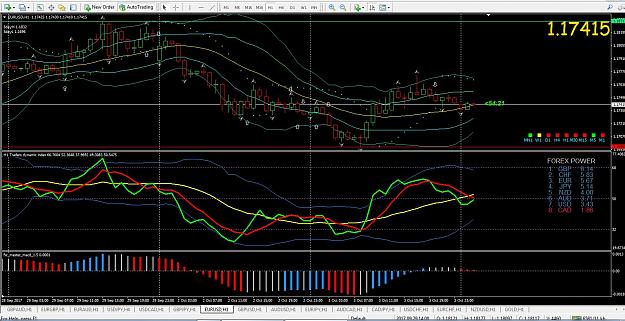
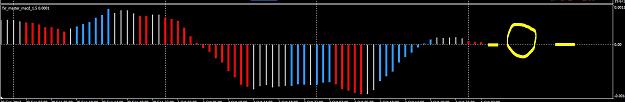
New MACD works best on 1H {image} MACD {image} Buy on blue when over the 0 line. Sell on red when below 0 line Close on GREY {image} You can change the the input figure for the Fast EMA from 12 to 10 Works best on 1H tf {file}
Ignored
Check the 4H chart for direction plus make sure the TDI is in aggreement