Short description for quantile(s) :
QuoteDislikedQuantile
From Wikipedia, the free encyclopedia
https://upload.wikimedia.org/wikiped...h_quantile.png
Probability density of a normal distribution, with quartiles shown. The area below the red curve is the same in the intervals (-∞,Q1), (Q1,Q2), (Q2,Q3), and (Q3,+∞).
In statistics and the theory of probability, quantiles are cutpoints dividing the range of a probability distribution into contiguous intervals with equal probabilities, or dividing the observations in a sample in the same way. There is one less quantile than the number of groups created. Thus quartiles are the three cut points that will divide a dataset into four equal-size groups (cf. depicted example). Common quantiles have special names: for instance quartile, decile (creating 10 groups: see below for more). The groups created are termed halves, thirds, quarters, etc., though sometimes the terms for the quantile are used for the groups created, rather than for the cut points.
q-Quantiles are values that partition a finite set of values into q subsets of (nearly) equal sizes. There are q − 1 of the q-quantiles, one for each integer k satisfying 0 < k < q. In some cases the value of a quantile may not be uniquely determined, as can be the case for the median (2-quantile) of a uniform probability distribution on a set of even size. Quantiles can also be applied to continuous distributions, providing a way to generalize rank statistics to continuous variables. When the cumulative distribution function of a random variable is known, the q-quantiles are the application of the quantile function (the inverse function of the cumulative distribution function) to the values {1/q, 2/q, , (q − 1)/q}.
Specialized quantiles
Some q-quantiles have special names:[citation needed]
- The only 2-quantile is called the median
- The 3-quantiles are called tertiles or terciles → T
- The 4-quantiles are called quartiles → Q; the difference between upper and lower quartiles is also called the interquartile range, midspread or middle fifty → IQR = Q3 − Q1
- The 5-quantiles are called quintiles → QU
- The 6-quantiles are called sextiles → S
- The 7-quantiles are called septiles
- The 8-quantiles are called octiles → O
- The 10-quantiles are called deciles → D
- The 12-quantiles are called duo-deciles → Dd
- The 16-quantiles are called hexadeciles → H
- The 20-quantiles are called ventiles or vigintiles→ V
- The 33-quantiles are called trigintatreciles → TT
- The 100-quantiles are called percentiles → P
- The 1000-quantiles are called permilles → Pr
Quantiles of a population
As in the computation of, for example, standard deviation, the estimation of a quantile depends upon whether one is operating with a statistical population or with a sample drawn from it. For a population, of discrete values or for a continuous population density, the k-th q-quantile is the data value where the cumulative distribution function crosses k/q. That is, x is a k-th q-quantile for a variable X if
Pr[X < x] ≤ k/q or, equivalently, Pr[X ≥ x] ≥ 1 − k/q
and
Pr[X ≤ x] ≥ k/q or, equivalently, Pr[X > x] ≤ 1 − k/q.
For a finite population of N equally probable values indexed 1, , N from lowest to highest, the k-th q-quantile of this population can equivalently be computed via the value of Ip = N k/q. If Ip is not an integer, then round up to the next integer to get the appropriate index; the corresponding data value is the k-th q-quantile. On the other hand, if Ip is an integer then any number from the data value at that index to the data value of the next can be taken as the quantile, and it is conventional (though arbitrary) to take the average of those two values (see Estimating the quantiles).
If, instead of using integers k and q, the p-quantile is based on a real number p with 0 < p < 1 then p replaces k/q in the above formulae. Some software programs (including Microsoft Excel) regard the minimum and maximum as the 0th and 100th percentile, respectively; however, such terminology is an extension beyond traditional statistics definitions.
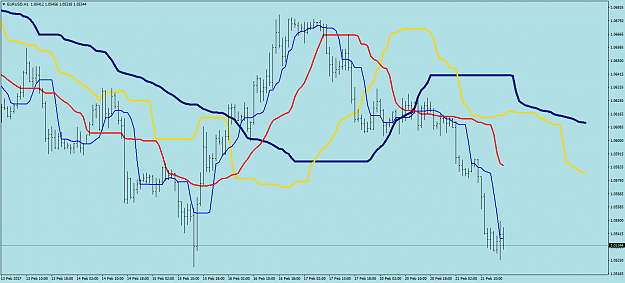
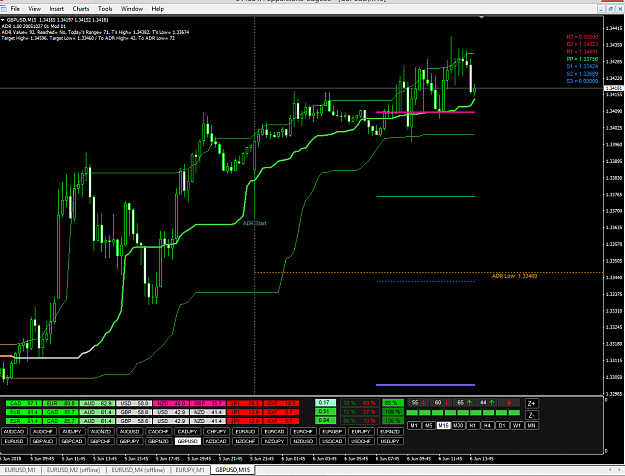
Metatrader 4 version of quantile bands :
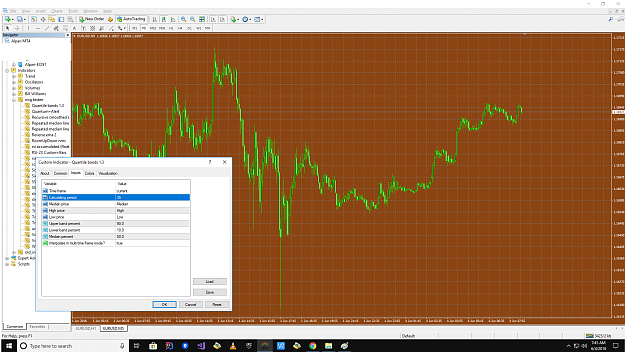
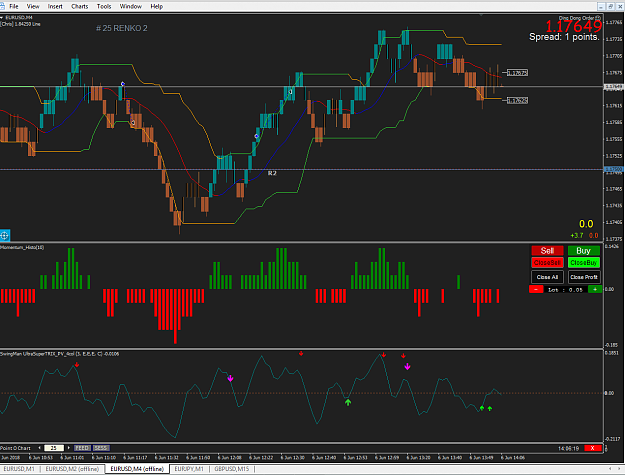
Metatrader 5 version :
Both versions are multi time frame already
_________________________________________________
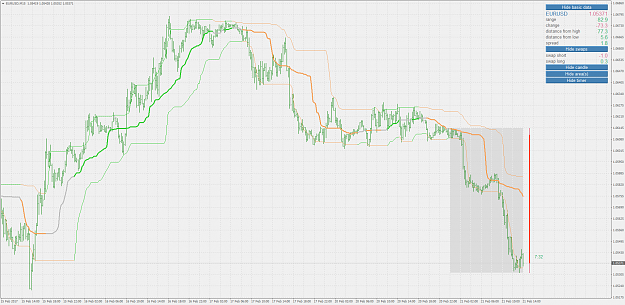
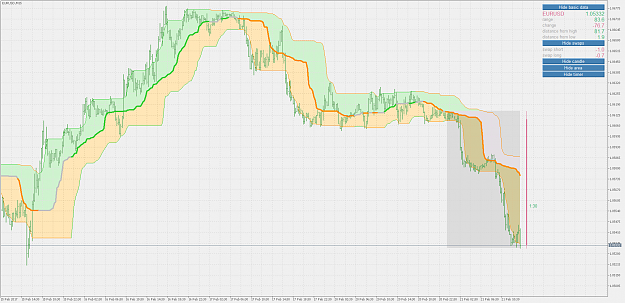
PS - what is probably not so obvious (and needs an explanation) :
The indicator middle line is not based on the slope of the middle quantile. Instead it is a combination of the two outer quantiles. When both outer quantiles are showing the same "trend" the color of the middle quantile is the same as the outer quantiles, otherwise it is "undetermined" (gray, if you use default settings)