Richard Dennis was one of the best trader. in 1986 he made $80 million.
He taught Turtles specific rules about position size, the use of stops, and to PYRAMID aggressively - up to a third of total exposure
Does it Work?
When Dennis experiment ended five years later, his Turtles reportedly had earned an aggregate profit of $175 million (80% CAGR). Some of those turtles went on to enjoy careers as successful commodity trading managers.
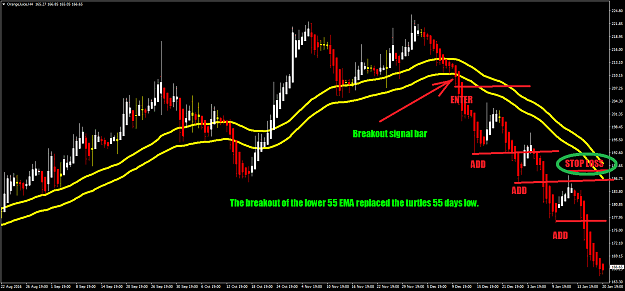
One of Dennis system was to buy (sell) when the price exceeds the high (low) of the preceding 55 days. All breakouts for System 2 would be taken whether the previous breakout had been a winner or not. The System exit was a 20 day low for long positions and a 20 day high for short positions.
But as you know you will get a lot of false signals.
==============================
Now in 2017 based in that channel who, have an idea to improve that system and avoid most of the false signals?
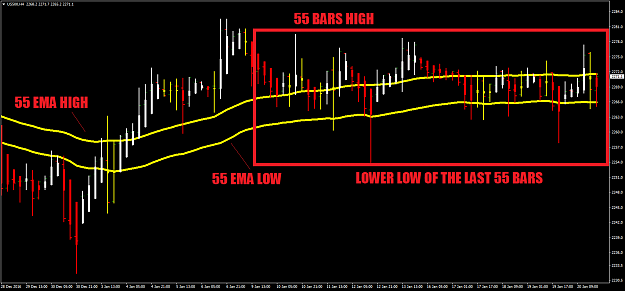
I like the idea of using the 55 EMA set to high and the 55 EMA set to low and to use Candle charts.
The rules to buy is a Candle close above the high of channel.
The rules to sell is a Candle close below the low of channel.
But still we get a lot of bad signals in sideway markets.
What are your ideas to add Modern Times indicators to improve Richard Dennis 55 days /bars BO system?
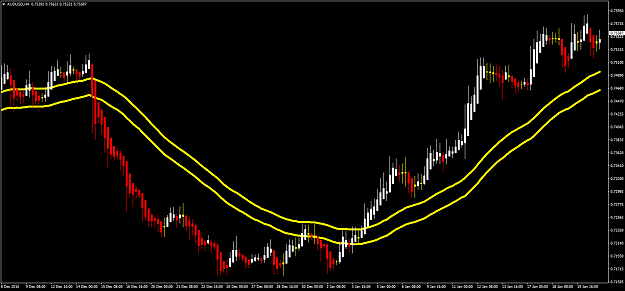
Below You can see the the AUDUSD 4H signal worked those time, but the SPY chart has failed a lot of times.
========================================
UPDATE:
ACETRADER IDEA
"
==============================================================
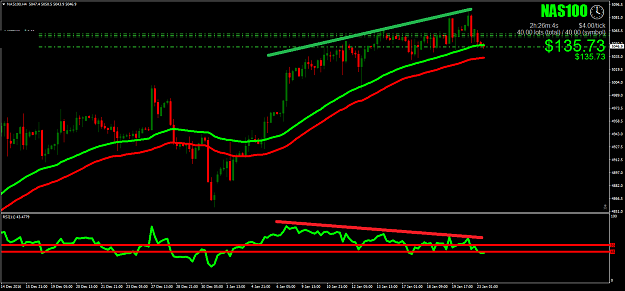
So using that idea we found a lower low in RSI (11) and we entered before the BO.
He taught Turtles specific rules about position size, the use of stops, and to PYRAMID aggressively - up to a third of total exposure
Does it Work?
When Dennis experiment ended five years later, his Turtles reportedly had earned an aggregate profit of $175 million (80% CAGR). Some of those turtles went on to enjoy careers as successful commodity trading managers.
One of Dennis system was to buy (sell) when the price exceeds the high (low) of the preceding 55 days. All breakouts for System 2 would be taken whether the previous breakout had been a winner or not. The System exit was a 20 day low for long positions and a 20 day high for short positions.
But as you know you will get a lot of false signals.
==============================
Now in 2017 based in that channel who, have an idea to improve that system and avoid most of the false signals?
I like the idea of using the 55 EMA set to high and the 55 EMA set to low and to use Candle charts.
The rules to buy is a Candle close above the high of channel.
The rules to sell is a Candle close below the low of channel.
But still we get a lot of bad signals in sideway markets.
What are your ideas to add Modern Times indicators to improve Richard Dennis 55 days /bars BO system?
Below You can see the the AUDUSD 4H signal worked those time, but the SPY chart has failed a lot of times.
========================================
UPDATE:
ACETRADER IDEA
"
DislikedComoesta.... On the 15M tf try RSI @ 8 or 11. Higher tf such as 4H RSI @ maybe different setting. The RSI at 8 on 4H may help give you advance warning of a change. This is just my view & nothing more. Give it a go at you own peril. Just trying to help. Best of trade to you my friend. Dennis seemed to have done well with this setup. ______________________Ignored
So using that idea we found a lower low in RSI (11) and we entered before the BO.
Attached Image(s) (click to enlarge)
he, alone, was to blame for his losses in the zero-sum game