This section intends to explain step by step my strategy of trading and how I use the MT4-Progress software to perform an easy trading.
We assume that your computer turns on a Windows system that has at least 8 GEGA memory to be able to handle Multi-Currency trading.
For a better trading it is better to have a big screen for a better view of what is happening. If you have a laptop connect it to a big screen and let run MT4-Progress on the big screen.
At this point you succesfully download the software and having a MT4 Platform on your computer.
Execute MT4-Progress.
Add your Broker in the MT4-Progress software. It is explained in this section Step 2 with the old version of MT4-Progress but it is the same : here.
The MT4-Progress comes with a Tutorial Project. Add this project to your MT4-Progress software. It is explained in this section Step 4 : here.
Once you succeeded to insert the project, we are ready to go to Section 2.
SECTION 2
The project comes with many strategies, these strategies are mainly written to explain the software, how to build them, etc.... Now the most important one are these :
- RSI_20_HEIKEN
- ENGULFING_D1
- RSI_2P_H1
I will explain these strategies later but these are the one I use.
Now let's stop a while and think of a plan to reach a goal. which goal ? If you are reading what I am writing , means you know about the forex market and you know how easy is to make money and loose money, simply because we can leverage. As we can leverage we want to have all the benefits of the leverage that is offered in the shortest time possible. In other terms you win the market, at the end of a period if your account gets bigger. So let's fix an average daily amount. I started by saying to open an account of 5000 dollars, in this case my goal will be 100 dollars a day of gain. Once I did them I stop everything for the day and I start again the second day. Let's say we succeeded of making an average of 100 $ a day, that makes at the end of the month 2000 $ which is 40 % of gain in a month. This is huge because that means if our goal stays at 100 dollars a day even when the account is growing at the end of the year we have a gain of 480 % !! and that makes 24000 $ account. Now if our average goal is 200 $ that makes 48000 $ at the end of a year from an initial 5000 dollars. I will work with you to reach the goal of 100 dollars/day for a initial 5000 $ account. You don't need to stay all day in front of the screen. This amount should be reached in a 4 hours maximum daily. By working on a multi-currency you have many opportunities every day. So be patient and selective once you decide for a trade. I will come back on this later.
SECTION 3
Now that we defined our daily goal , how can we achieve this ? Automatic strategies ? Manual trading ? Semi automatic Strategies ? (Semi Automatic means that your strategy gives you a start signal but you decide when to start it). The answer is Semi automatic and Manual trading. I will not explain why here but the best answer I can say is that "you can't win a war without feet on the ground".
If you look on the chart window of MT4-Progress, It only offers the H1 period charts for 2 reasons the first is that I work alone on the software and I tried to make the best software solution in a shortest time but improvements will still go on and second which is the most important reason is that H1 and D1 are the only charts that I look on when I trade (I look sometimes on shortest periods to recover a loosing position). The H1 chart in MT4-Progress shows me an historical of 3 days with pivots lines of these 3 days and that's all. This what I need for manual trading.
But first of all before starting I look at the orientation of the different currencies, to see the actual trend and this is related to the Daily chart. So how I define the orientation of a currency ? Everyone has his method of determining the orientation of a currency , I explain the one I use that I found here on a forum and it get removed. It works fine. You can use your own it is not important, but have a look at this one :
if HEIKEN_ASHI indicator is green for the period D1 (daily) and W1 (weekly) and the RSI (20) indicator for the period D1 is above the average 30 , the market is up.
if HEIKEN_ASHI indicator is red for the period D1 (daily) and W1 (weekly) and the RSI (20) indicator for the period D1 is below the average 30 , the market is down.
Otherwise the market is either correcting or uncertain.
In the picture below the upper window is RSI (period 20) for the period D1 (daily), the middle window is Heiken_Ashi for the period W1 (weekly) and the lower window is Heiken_Ashi for the period D1 (daily). When the 3 are green means the orientation is up , when the 3 are red the market is down. The best is to catch the signal when 2 of the 3 are green than the third turns to green at the beginning.
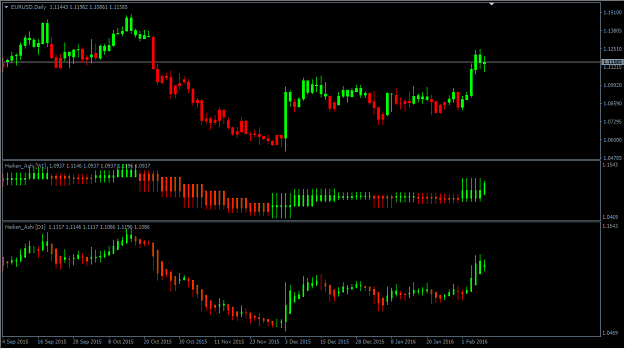
Here you can download the template of this indicator. (download indicator)
These charts are the one I load in my MT4 platform. So I have 2 views the Daily chart with the template above on MT4 platform and the H1 chart in the MT4-Progress software on a different screen with my pivot lines of the last 3 days .
The daily orientation is not enough. I trace also the Fibonnaci Lines to see if we reach a support or a resistance. This is important even when the orientation is up (green in the 3 windows), I look to see if price reached a Fibo Line zone, so I know we have a support resistance line and in this case we watch carefully our trading. One last think I look is the bar of the day and the previous day.
Let's recapitulate. For every currency on my MT4 platform :
- First I look at the orientation with the template explained above.
- I trace Fibo Lines.
- I look on the bar of the day and the previous day : (engulfing, shooting start or hammer )
Now that I have my orientation and a global view of my currency I start with my software, which is explained in the next section.
SECTION 4
When you launch MT4-Progress software it should look like the image below. To insert your currencies , launch Progress Expert Asdvisor in your MT4 Platform for all currencies you want to trade. It will be all displayed in the software in the upper left corner.The Signals window and the Alerts window should be empty as you didn't define yet the signals and alerts you want.
In the middle you have the charts window that it is related to currencies where MT4-Progress is running. You can see the 3 days pivots-lines on every chart.
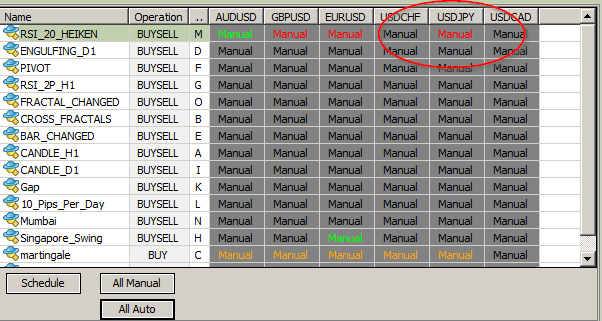
In the Strategy Window you have all strategies that were defined in the designer of the tutorial project. Nothing will be launched as all strategies are set to manual. From the colors you can know when the strategy is set to run in the current market.
![Click to Enlarge
Name: 2016-02-24 13_48_44-Progress Trading Station [Alpari Limited MT4] Normal Mode.png
Size: 162 KB](/attachment/image/1864726/thumbnail?d=1456357819)
Now here are the alerts that I set in my project. Do the same. Click on Alerts menu above and int the GLOBAL Tab define the same alerts as showed in the picture below. I let you do it to get used to the interface. When you define it in GLOBAL this will be applied to all currencies.
Here is what is defined for my alerts. You can add your own if you want but here are the alerts that I use :
- BULL_ENGULFING for the current bar for the Period D1
- BEAR_ENGULFING for the current bar for the Period D1
- BEAR_SHOOTING_STAR (1, 2) for the previous bar for the Period D1 or H1
- BULL_HAMMER (1, 2) for the for the previous bar for the Period D1 or H1
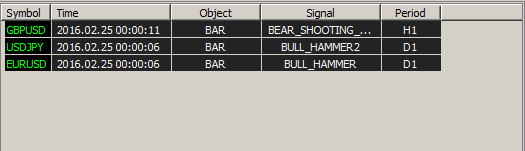
Set Graphic to On for all these alerts and Sound On in case you want to be alerted by a voice. These alerts will be shown in the Alerts Window . In the image above we have a bull engulfing for the currencies AUDUSD and GBPUSD on the previous bar for the period H1 and the time it occured.
In the stragegy Window I can know the Orientation of my currency from the strategy RSI_HEIKEN. It starts when the 3 indicators are either green or red, (this has been explained above) , when the colour is red it means the orientation is down and when it is green it means the orientation is up. I will not explain here the construction of this strategy but if you want to have a look just go to designer and then double-click on the strategy so you can see how it works.
Now I need to define my signals. The signals I look on very often are the velocity for the period M5 (when it is > 15 or < -15 means the market is active), the HEIKEN_ASHI and RSI_20 indicators also, by having these signals it confirm to me the momentum and the orientation of the currency. I also define the UPFRACTAL and the DOWNFRACTAL by looking at the periods H4 and D1 signals which indicates to me a support or a resistant is broken. At this stage you can insert the signals you want as it is not crucial for my strategy of trading. It is only a confirmation. To add a signal right-click on the Signal Window and add your signals. Right-Click in the Signals Window and you add your Signals as indicated in the image below.
![Click to Enlarge
Name: 2016-02-24 22_37_20-Progress Trading Station [Alpari Limited MT4] Normal Mode.png
Size: 27 KB](/attachment/image/1864728/thumbnail?d=1456357889)
It can be a lot of things to do. Take your time. once everything is settled you don't have to do it every time.
Now let's define a daily target in MT4-Progress Software. At the start I said that for an initial account of 5000 my daily target is 100 dollars. We can precise a daily target in the software, that means when I reach this amount all orders are closed in all currencies.
In the image below, we have in Daily Targets Tab the column Target where I have set the amount of 150. I put a larger amount than the 100 dollars in case I can see more profit , I let it run to this amount.
I can change it at anytime simply by double clicking on the cell GLOBAL Target and edit the amount I want.*
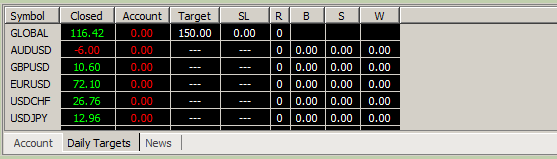
*By Editing -1 , this means no target is Set, And by Editing 0 no orders can be done as our daily target is 0.
Now that everything is set , let's explain my strategy of trading.
SECTION 5
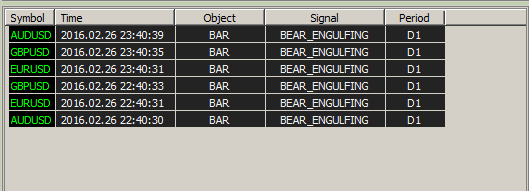
While I am editing this note, it is actually 00 hours on my broker Terminal 25/2/2016. Here are my Alerts window.
I have a BULL_HAMMER for the period D1 for the currency USDJPY , a BEAR_SHOOTING STAR for the period H1 for the currency GBPUSD and another BULL_HAMMER for the period D1 for the currency EURUSD. All these alerts are on the previous bar as we defined them in the Alerts Dialog above.
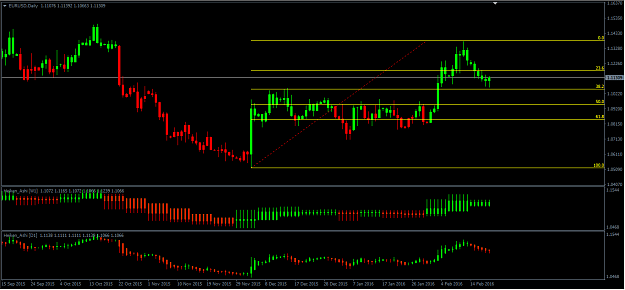
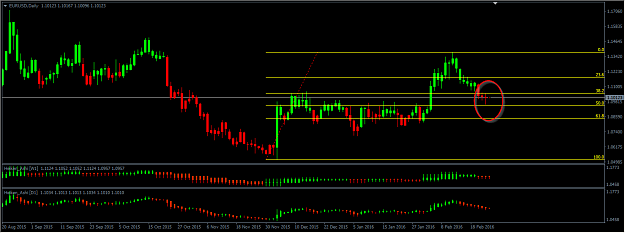
Let's begin with USDJPY. I look at the D1 chart of the USDJPY of my MT4 Platform. The image below is what I see :
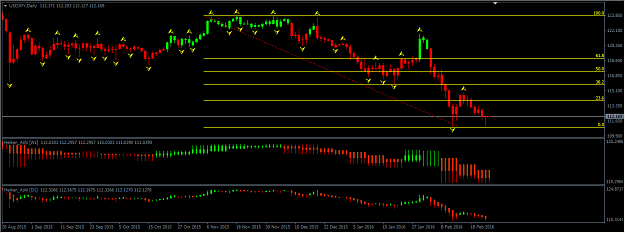
You can see a Bull Hammer that touches the Fibo Line for the previous day, although the orientation is Down as the 3 indicators are in the red (this is confirmed by the Automatic Strategy indicator) , this means that I can be in an Up move for today. Here why look always at the D1 Period before taking a decision. So for today I am expectation is an Up movement for the currency USDJPY although the orientation is indicating me a Down Orientation.
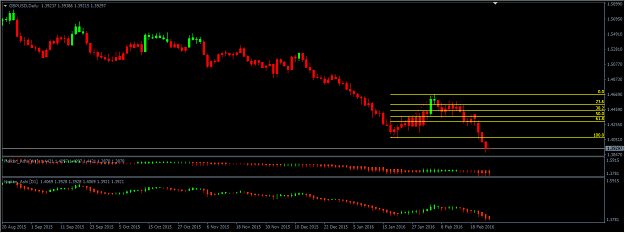
The currency EURUSD is similar to USDJPY, let's have a look on the D1 period with our template, here is the image :
You can see the Bull Hammer for the previous day although the orientation is down. The same as USDJPY we can expect an UP movement for the EURUSD during the day.
For these 2 currencies we will wait for alerts (BULL Hammer or Shooting star for the H1 Period) that intersects with any of the Pivot lines of the last 3 days before taking any trade.
![Click to Enlarge
Name: 2016-02-24 23_46_28-Progress Trading Station [Alpari Limited MT4] Normal Mode.png
Size: 70 KB](/attachment/image/1864737/thumbnail?d=1456358309)

![Click to Enlarge
Name: 2016-02-26 22_00_43-Progress Trading Station [Alpari Limited MT4] Normal Mode.png
Size: 15 KB](/attachment/image/1866695/thumbnail?d=1456520622)
![Click to Enlarge
Name: 2016-02-26 22_13_22-Progress Trading Station [Alpari Limited MT4] Normal Mode.png
Size: 43 KB](/attachment/image/1866699/thumbnail?d=1456521379)
![Click to Enlarge
Name: 2016-02-26 22_30_18-Progress Trading Station [Alpari Limited MT4] Normal Mode.png
Size: 42 KB](/attachment/image/1866704/thumbnail?d=1456522462)
![Click to Enlarge
Name: 2016-02-26 22_43_14-Progress Trading Station [Alpari Limited MT4] Normal Mode.png
Size: 49 KB](/attachment/image/1866708/thumbnail?d=1456523295)