hukam, a very interesting idea! abokwaik, your threads are fantastic and always thought-provoking! Could one use a HVC (high volume candle - defined as the opposite of the LVC, i. e. indicating strong players) pointed along the direction of next LVC as an entry trigger? Could one say that the HVC is less likely to be retraced? Cheers, k
Ignored
thanks, yes it may be valid reason for entry.
Dear khalil, try this High Volume - compare to X pips history.
hukam, a very interesting idea! abokwaik, your threads are fantastic and always thought-provoking! Could one use a HVC (high volume candle - defined as the opposite of the LVC, i. e. indicating strong players) pointed along the direction of next LVC as an entry trigger? Could one say that the HVC is less likely to be retraced? Cheers, k
Ignored
This is interesting K, is there any HVC indicator available, or we must create it first ?
Thanks
{quote} This is interesting K, is there any HVC indicator available, or we must create it first ? Thanks
Ignored
I don't think so, but it should be easy to make it from the LVC indicator.
I am curious about the stats, and would take a look at them when I find the time.
I think I could modify the RecurrenceStatistic for this case easily.
{quote} impossible, you miss the whole class.. please read first page ( all pages)
Ignored
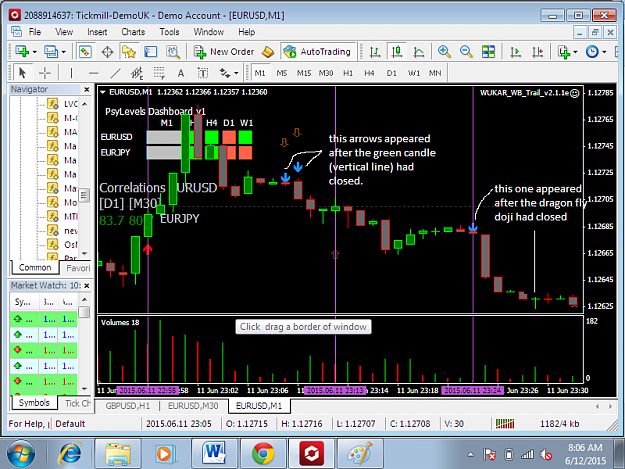
Good morning Hukim. I cant tell you how happy I was when I saw your thread on tick volume because I have been studying them recently. Please I have a question. The arrow up or down appears after some candles had already form and closed. The chart below will make this point more clear. I thought it was suppose to appear while a candle is forming or immediately after a closed candle. Please any body familiar with this system can also reply. thank you
{quote} I don't think so, but it should be easy to make it from the LVC indicator. I am curious about the stats, and would take a look at them when I find the time. I think I could modify the RecurrenceStatistic for this case easily. k
{quote} Good morning Hukim. I cant tell you how happy I was when I saw your thread on tick volume because I have been studying them recently. Please I have a question. The arrow up or down appears after some candles had already form and closed. The chart below will make this point more clear. I thought it was suppose to appear while a candle is forming or immediately after a closed candle. Please any body familiar with this system can also reply. thank you {image}
Ignored
That's normal. And keep in mind that the arrows aren't entry signals but levels for exit ...
{quote} That's normal. And keep in mind that the arrows aren't entry signals but levels for exit ...
Ignored
thank you ferrufx. in other words, the statement in post 44 is wrong because i thought the arrow appears on a candle before it closes so that i could trade the next candle.
{quote} This looks like an interesting method. Thank you both for the idea and the indicator. It looks like there are so many ways a trader can use this very useful tool. I would suggest an alarm for warning so that one isn't stuck in front of computer all day. Thanks to you all once again.
Ignored
No alarm needed as this will grow into an EA later on.
hukam, a very interesting idea! abokwaik, your threads are fantastic and always thought-provoking! Could one use a HVC (high volume candle - defined as the opposite of the LVC, i. e. indicating strong players) pointed along the direction of next LVC as an entry trigger? Could one say that the HVC is less likely to be retraced? Cheers, k
Ignored
Hi kprsa,
Nice to see you here.
HVCs would usually appear at:
-Red News : Some times creating a Gap : which is some sort of LVC, actually a ZVC (Zero Volume Candle), not quite a candle on regular time frames, but rather a Zero Volume Area with time length in milliseconds. LVC should also take care of those ZVCs, as most probably they will get filled later.
- Bounce off Support/Resistance Areas : In this case entry on second failed try is usually better than entry on first touch (as we still don't know if it will bounce or break the area). Failed second try will create a Lower High or Higher Low, which give us an entry with clear R:R.
- Break of Support/Resistance Areas: In this case usually prices retraces for a test of broken level to convert to opposite type. So for example if a Resistance level is clearly broken with High Volume, it is safer to enter on a retrace that would create a Higher Low, converting that level to a support level.
So entry on a completed High Volume candle could be too late to jump into the trade.
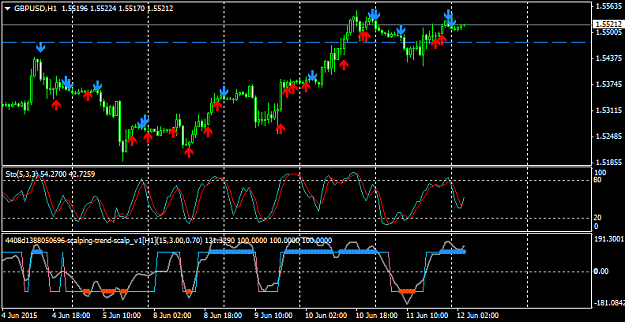
I still see some posts assuming that LVC arrows are for entry.
LVC arrows appear after x number of following candles,
the larger the number of following candles the more reliable the signals, but also become rare.
The arrows are potential exit points for a counter trade.
So for example if a Long Entry Target signal appears, the trader should start to evaluate a long entry, based on what ever analysis he has for a reversal of the current short-term trend.
Entry analysis can be based on : all types of S/R, Fibo, Candle Patterns, OB/OS levels, Divergence ... etc.
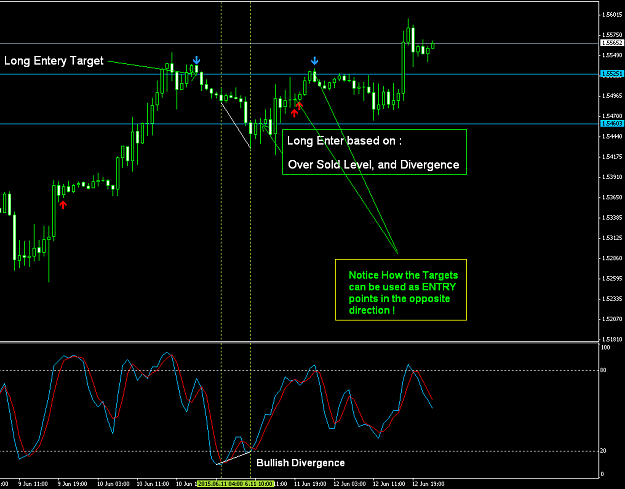
Example of a Long Entry based on Oversold and Bullish Divergence. GBP/USD H1 with x=8 for future candles.
Important notice in the above chart (in lime) , and could be used to make the first EA version :
Price level of LVCs which represent a potential EXIT target for future entries, can be used as ENTRY points in the opposite direction.
EDIT :
OK, after reading this post, I think it can be miss-understood. So I will explain more:
- In the above example : a trader would have taken a long entry @ 1.5460 targeting the close of the candle with the first Blue Arrow @ 1.5525 (as the last 2 red, and 1 blue arrow would not have been appeared yet).
- What I tried to say in the Notice, is that price 1.5525 which represent a potential EXIT target for our long entry, can be used to take a Short trade. Because Closing a Long trade is essentially a Short trade. So if we take a Short trade @ 1.5525 after we close the long trade, we'll notice that after 4 candles from taking the short trade the first red arrow will appear to tell us the potential exit target @ around 1.4990 for our short trade. Once closed we can take a new Long Trade @ 1.4990, and by that time the second blue arrow would have already appeared for a potential target @ 1.5515.
I still see some posts assuming that LVC arrows are for entry. LVC arrows appear after x number of following candles, the larger the number of following candles the more reliable the signals, but also become rare. The arrows are potential exit points for a counter trade. So for example if a Long Entry Target signal appears, the trader should start to evaluate a long entry, based on what ever analysis he has for a reversal of the current short-term trend. Entry analysis can be based on : all types of S/R, Fibo, Candle Patterns, OB/OS levels, Divergence...
Ignored
Hello abokwaik,
now its very clear....
Thanks for your clear explanation.
Important notice in the above chart (in lime) , and could be used to make the first EA version : Price level of LVCs which represent a potential EXIT target for future entries, can be used as ENTRY points in the opposite direction. EDIT : OK, after reading this post, I think it can be miss-understood. So I will explain more: - In the above example : a trader would have taken a long entry @ 1.5460 targeting the close of the candle with the first Blue Arrow @ 1.5525 (as the last 2 red, and 1 blue arrow would not have been appeared yet). - What I tried to say in the Notice, is that price 1.5525 which represent a potential EXIT target for our long entry, can be used to take a Short trade. Because Closing a Long trade is essentially a Short trade. So if we take a Short trade @ 1.5525 after we close the long trade, we'll notice that after 4 candles from taking the short trade the first red arrow will appear to tell us the potential exit target @ around 1.4990 for our short trade. Once closed we can take a new Long Trade @ 1.4990, and by that time the second blue arrow would have already appeared for a potential target @ 1.5515.
Ignored
I`m sure you mean an exit target of 1.5490 instead of 1.4990...right?
And therefore new Long Trade @ 1.5490 for a potential target @ 1.5515...
{quote} I`m sure you mean an exit target of 1.5490 instead of 1.4990...right? And therefore new Long Trade @ 1.5490 for a potential target @ 1.5515...[/quote]
I also believe volume is important. But IMO, what's high, what's low ? How is it significant? is it reliable? Example USDCAD 1 Min High volume candles impulse UP (blue) Low volume candles impulse DOWN (red) Impulse UP > impulse DOWN therefore buy the low volume candles (: {image}
Ignored
Hi Mingary,
This is your chart with Long Entry Target LVC on it.