Hello traders,
We would like to introduce a method that is used personally by our team that we called the Orderflow Meta-Gaming.
Before we get into the main topic however, it is required that we teach you guys the basics of orderflow in order for everything to make sense.
Basics To Orderflow:
The market can be divided into 2 main players, the Market Maker and the Retail Traders. Something that most people tend to not understand though is that Market Makers aren't simply retail traders with deep pockets.
Instead, the life of a Market Maker is actually very restricted and they are required to follow different set of rules and have different requirements.
Example: Market Makers are legally required to ALWAYS be in the market. This is a restriction that not many traders can live with and it also brings out the requirement for Market Makers to have a lot of money.
Because of this fact Market Makers are in a sense forced to hunt stops on a daily basis. Many retail traders hate this fact, but it is their job.
Now understand what we just said. They are forced to hunt for stops every day. This means that if we can find where they hunt, then we can take advantage of it and ride same ride that the Market Makers are riding.
This is where our method comes in because Market Makers can't hide their activity completely. Their actions naturally create price patterns on the charts that reveals their intent.
How do you find Market Maker Activity From the Chart?
First things first, let's dissect the market a bit.

This is what people call a DOM. Might be the first time many of you guys are seeing this, but it's not complicated as it looks. Now the arrows that you see their points to limit orders. Many people on FX seem to confuse Market Order(Stops) and Limits, but simply put, Limit orders are the walls that prevent price from moving to the next level. You can have 1000000 buy Order, but if there's 1000001 limit orders to block those orders, then the market won't budge an inch.
So Let's do some math. From looking at the DOM, how many market orders does it take At that moment to move price to 120 05.00 (Exclude Other Ideas)? 2320 Buy Orders are required to move the price to 120 05.00
Now this picture was taken during off hours, and normally the limit orders would be in the 1000s, but you guys get the point. To move the market up 10+ Ticks, someone needs to make major market order and most retail traders don't have that kind of bankroll and wouldn't want to take such a bet.
The most likely person to be able to make that kind of order is a Market Maker and this is how you find it on the chart.
Because when you see a the chart moving 10 ticks within 1 min that means that a Market Maker has made his move and the result is a giant bar (Orderflow Gap)
The beauty of these gaps is something that you've all experienced many times in your trading career. You hold on to a position, but the Market swings against you 20 pips. You Panic and start feeling trapped. Eventually you reach a point where you decide to liquidate your position. These are the type of situation that Market Makers want you to be in.
Knowing what is a gap, however, is not enough to trade with an underlying edge. There isn't only 1 Market Maker in the world and there are many reasons why price can form a gap.
So to add more edge to our side, we must incorporate a meta-game approach (after all, the markets are generated by emotion) to be in alignment with our dear old Market Maker pals.
OFMG:
This is what we call a LT Gap (Liquidity Trap Gap)
So let's analyze that situation you see there on the price chart.
1. Buy orders initially push the market significantly in an upward direction. This is the first gap.
2. During this phase many people are believing that the market is ready to turn around and start pressing the buy button. Creating some highs along the way.
3. Market Makers though have different opinion on where price is moving and decides to start shorting the market.
4. With the deep pockets of Market Makers, price gets pushed down and begins to trap the buyers from phase 1
5. This creates huge pressure on the people who bought at the first gap and eventually they liquidate their positions and propels the market to move further down
6. From that point on, the Market Makers have now revealed their true intentions. They didn't like the idea that price was moving above that red box. They preferred it stay below. So what you get is a True S/R.
A S/R that's not based on technical analysis but a true S/R that is based on Orderflow.
Summary: A gap that is closed within the previous gap shows a liquidity trap made by Market Makers.
Capitulation Gap:
1. Market Forms H/Ls and during these times traders begin placing their stop orders.
2. Market Makers begin to sense that there is more stops and liquidity at the top and begins to hunt for them.
3. During this time the stops begins to fuel more move towards the top side.
4. Gap Creates a S/R Zone and once price hits it, it creates a bounce.
Summary: Market creates a H/L and traders begin placing stop orders. Once this happens Market Makers start attempting to trigger these stops and once triggered, the stops help propel the market into the Market Maker's wanted price.
With these 2 setups that you see here, you should now begin to find S/R based on real orderflow and this will greatly help you in your trading career.
We will continue updating this page as time goes on and will also post any setups that we may find on this thread.
If you guys want to see our Algo in live action, then visit us at www.orderflowcamp.com
If you have any questions please feel free to ask,
Orderflowcamp
We would like to introduce a method that is used personally by our team that we called the Orderflow Meta-Gaming.
Before we get into the main topic however, it is required that we teach you guys the basics of orderflow in order for everything to make sense.
Basics To Orderflow:
The market can be divided into 2 main players, the Market Maker and the Retail Traders. Something that most people tend to not understand though is that Market Makers aren't simply retail traders with deep pockets.
Instead, the life of a Market Maker is actually very restricted and they are required to follow different set of rules and have different requirements.
Example: Market Makers are legally required to ALWAYS be in the market. This is a restriction that not many traders can live with and it also brings out the requirement for Market Makers to have a lot of money.
Because of this fact Market Makers are in a sense forced to hunt stops on a daily basis. Many retail traders hate this fact, but it is their job.
Now understand what we just said. They are forced to hunt for stops every day. This means that if we can find where they hunt, then we can take advantage of it and ride same ride that the Market Makers are riding.
This is where our method comes in because Market Makers can't hide their activity completely. Their actions naturally create price patterns on the charts that reveals their intent.
How do you find Market Maker Activity From the Chart?
First things first, let's dissect the market a bit.
Attached Image
This is what people call a DOM. Might be the first time many of you guys are seeing this, but it's not complicated as it looks. Now the arrows that you see their points to limit orders. Many people on FX seem to confuse Market Order(Stops) and Limits, but simply put, Limit orders are the walls that prevent price from moving to the next level. You can have 1000000 buy Order, but if there's 1000001 limit orders to block those orders, then the market won't budge an inch.
So Let's do some math. From looking at the DOM, how many market orders does it take At that moment to move price to 120 05.00 (Exclude Other Ideas)? 2320 Buy Orders are required to move the price to 120 05.00
Now this picture was taken during off hours, and normally the limit orders would be in the 1000s, but you guys get the point. To move the market up 10+ Ticks, someone needs to make major market order and most retail traders don't have that kind of bankroll and wouldn't want to take such a bet.
The most likely person to be able to make that kind of order is a Market Maker and this is how you find it on the chart.
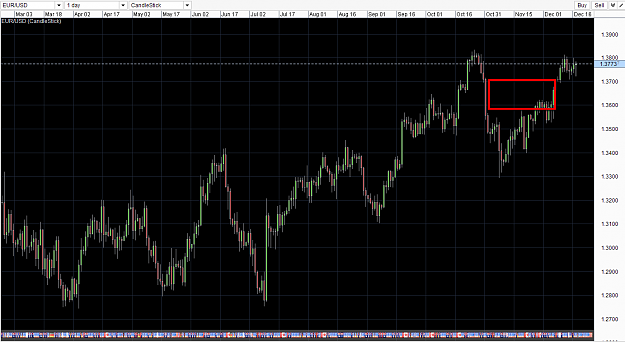
Because when you see a the chart moving 10 ticks within 1 min that means that a Market Maker has made his move and the result is a giant bar (Orderflow Gap)
Attached Image (click to enlarge)
The beauty of these gaps is something that you've all experienced many times in your trading career. You hold on to a position, but the Market swings against you 20 pips. You Panic and start feeling trapped. Eventually you reach a point where you decide to liquidate your position. These are the type of situation that Market Makers want you to be in.
Knowing what is a gap, however, is not enough to trade with an underlying edge. There isn't only 1 Market Maker in the world and there are many reasons why price can form a gap.
So to add more edge to our side, we must incorporate a meta-game approach (after all, the markets are generated by emotion) to be in alignment with our dear old Market Maker pals.
OFMG:
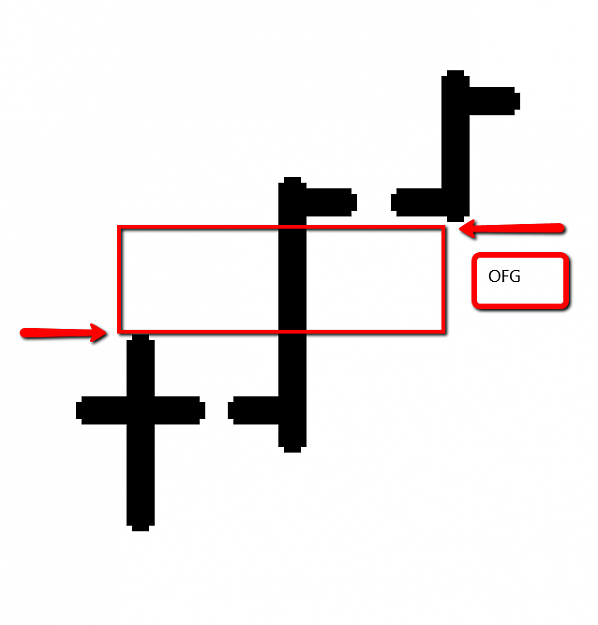
Attached Image (click to enlarge)
This is what we call a LT Gap (Liquidity Trap Gap)
So let's analyze that situation you see there on the price chart.
1. Buy orders initially push the market significantly in an upward direction. This is the first gap.
2. During this phase many people are believing that the market is ready to turn around and start pressing the buy button. Creating some highs along the way.
3. Market Makers though have different opinion on where price is moving and decides to start shorting the market.
4. With the deep pockets of Market Makers, price gets pushed down and begins to trap the buyers from phase 1
5. This creates huge pressure on the people who bought at the first gap and eventually they liquidate their positions and propels the market to move further down
6. From that point on, the Market Makers have now revealed their true intentions. They didn't like the idea that price was moving above that red box. They preferred it stay below. So what you get is a True S/R.
A S/R that's not based on technical analysis but a true S/R that is based on Orderflow.
Summary: A gap that is closed within the previous gap shows a liquidity trap made by Market Makers.
Capitulation Gap:
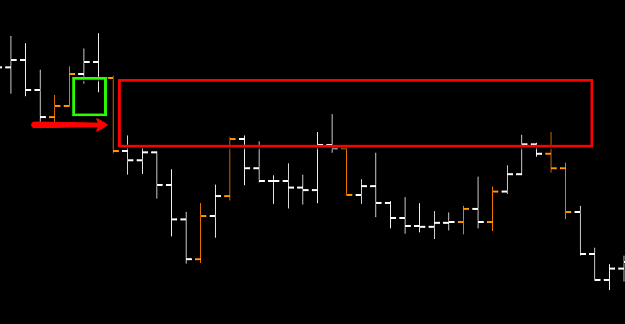
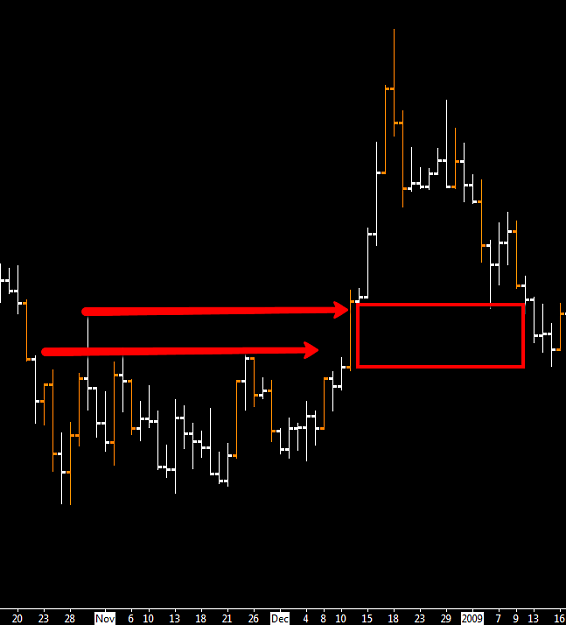
Attached Image (click to enlarge)
1. Market Forms H/Ls and during these times traders begin placing their stop orders.
2. Market Makers begin to sense that there is more stops and liquidity at the top and begins to hunt for them.
3. During this time the stops begins to fuel more move towards the top side.
4. Gap Creates a S/R Zone and once price hits it, it creates a bounce.
Summary: Market creates a H/L and traders begin placing stop orders. Once this happens Market Makers start attempting to trigger these stops and once triggered, the stops help propel the market into the Market Maker's wanted price.
With these 2 setups that you see here, you should now begin to find S/R based on real orderflow and this will greatly help you in your trading career.
We will continue updating this page as time goes on and will also post any setups that we may find on this thread.
If you guys want to see our Algo in live action, then visit us at www.orderflowcamp.com
If you have any questions please feel free to ask,
Orderflowcamp