Hi everyone,
The latest Commitments of Traders review is out (here).
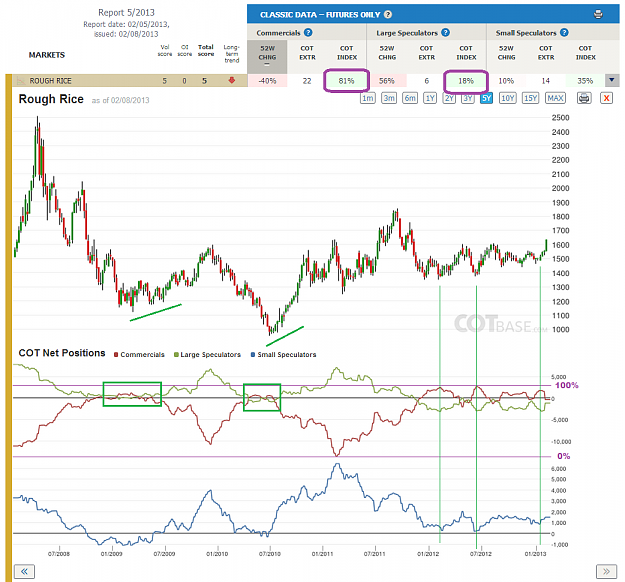
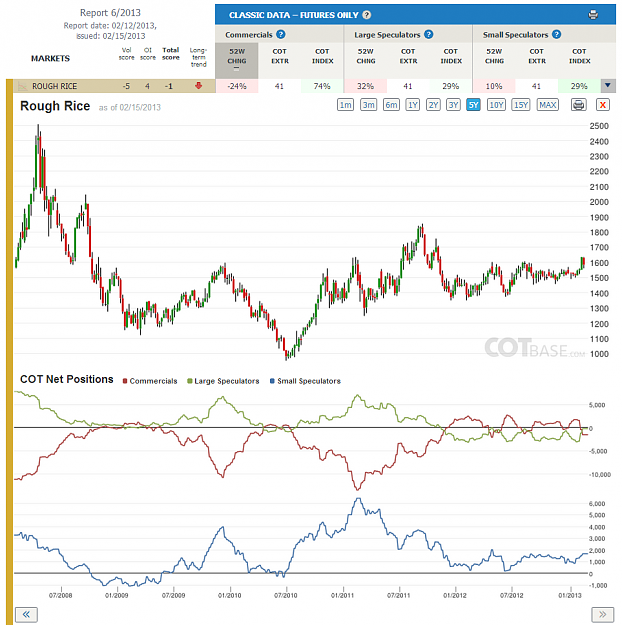
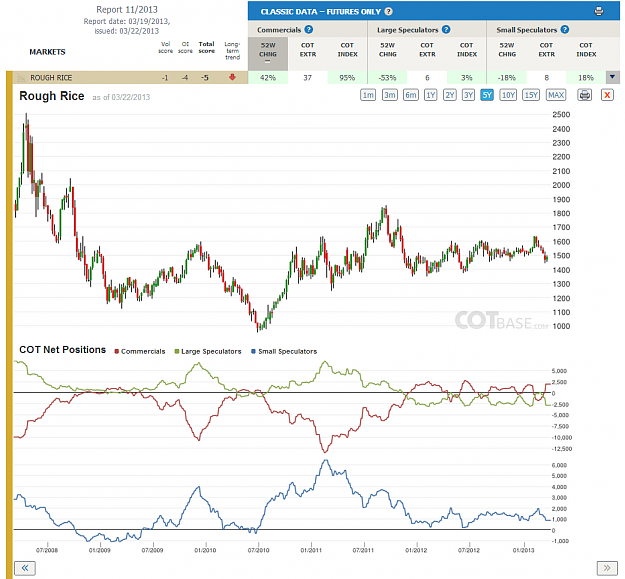
Rough Rice
COT Change (52W) / C-40%, LS-56% /
COT Index (5 year lb.) / C-81%, LS-18%, SS-35% /
I can’t agree with the review this time. Thomas didn’t look at the 5-year chart, which tells us a very different story… This is why I recommend all of you, to always open a longer term chart, besides the default one year, since the cot extreme can only be checked on those. While the one year long chart suggests that a good sell opportunity is in formation, the 5 year long chart shows that we are at a COT extreme. Of course there is no question to the fact that the cot change was large – we may see a decline in prices in the near term (or maybe not) – but on the other hand, the long term picture to me is definitely bullish.
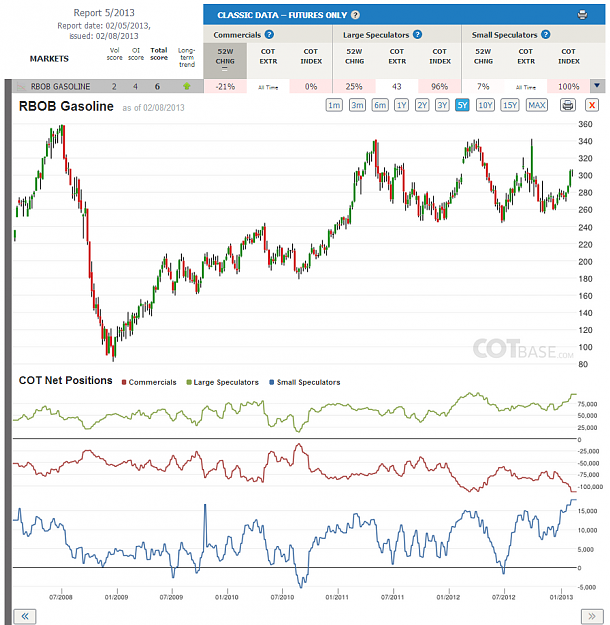
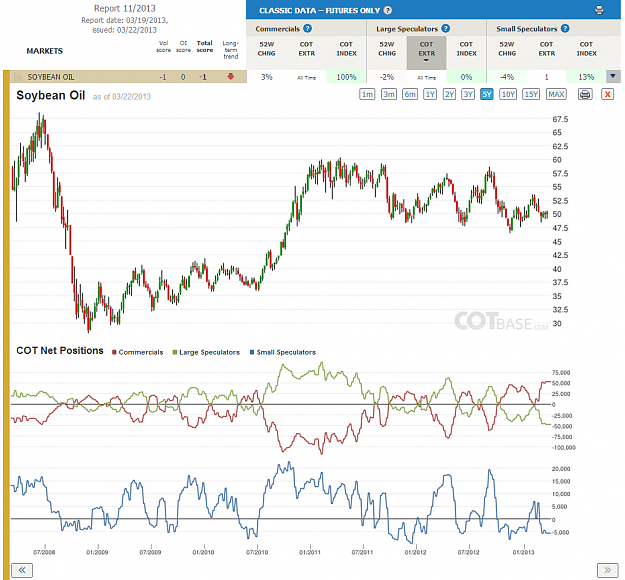
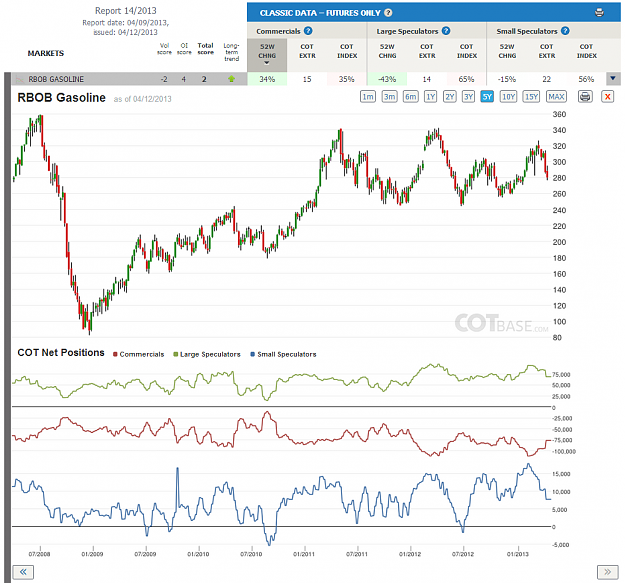
RBOB Gasoline
COT Change (52W) / C-21%, LS-25% /
COT Extreme / C & SS-All Time COT extreme /
Both signals, the COT change and the COT extreme are talking about a bearish picture. Although I agree, I wouldn’t be surprised if this cot extreme widened a bit more. I’ve told you before a couple of times, that COT analysis can be used best, if combined with regular technical analysis. I don’t really see – TA speaking – anything against the continuation of this rally. Consequently I would stay aside until the situation changes, but it’s definitely good to know – and that’s why following the COT report is useful – that stress levels are high in this market.
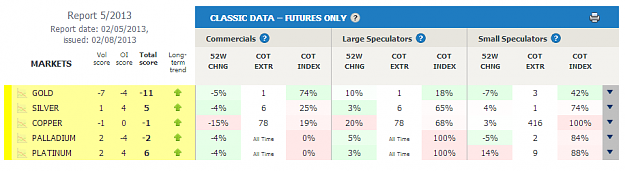
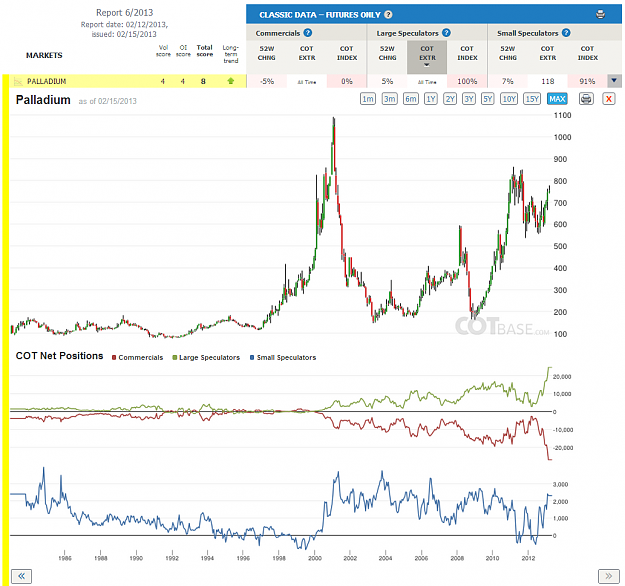
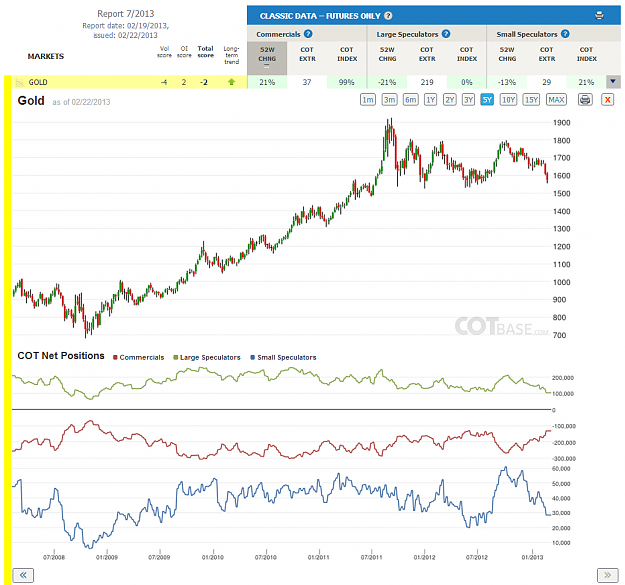
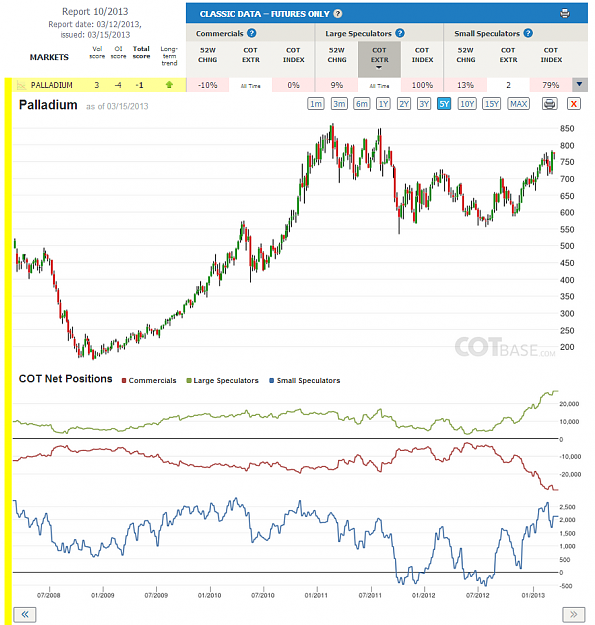
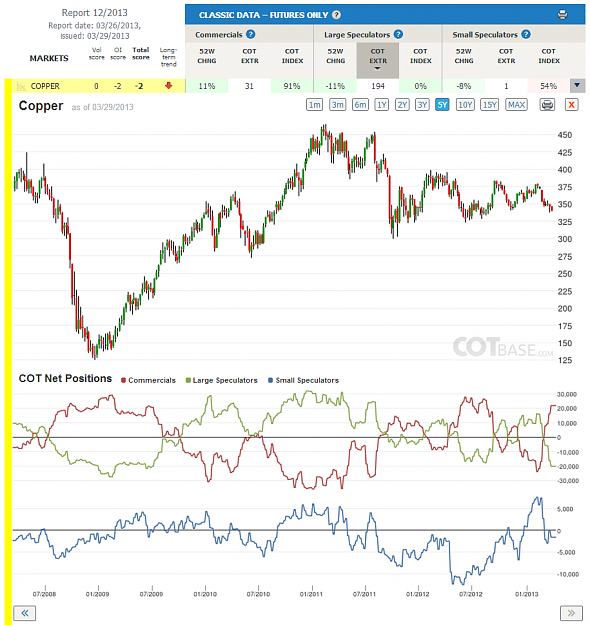
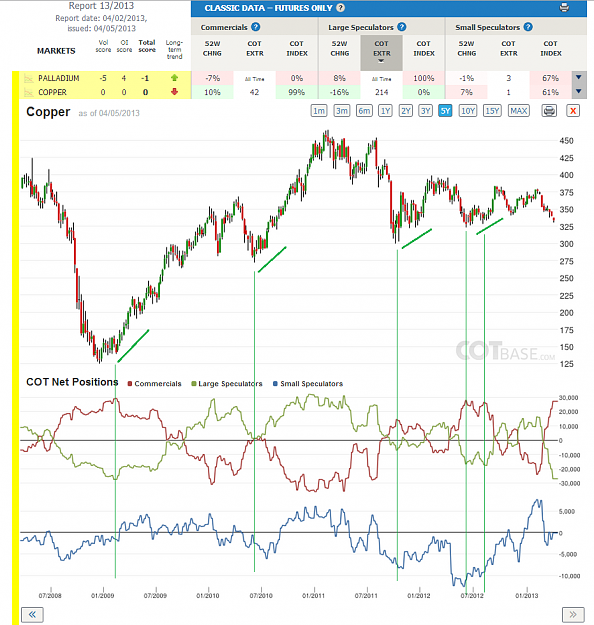
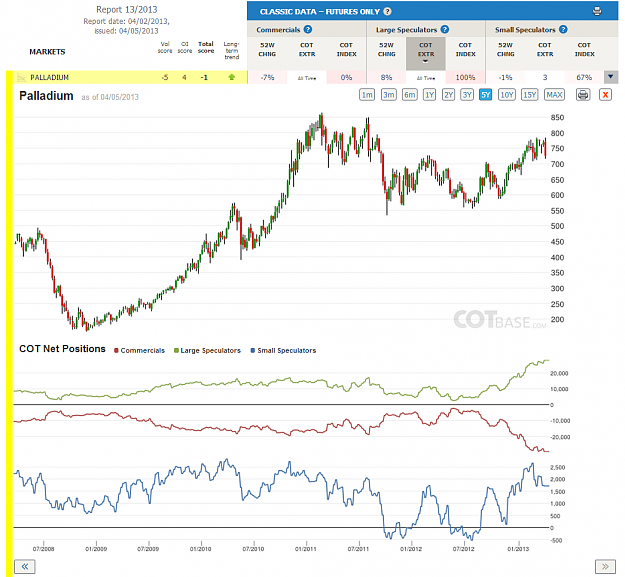
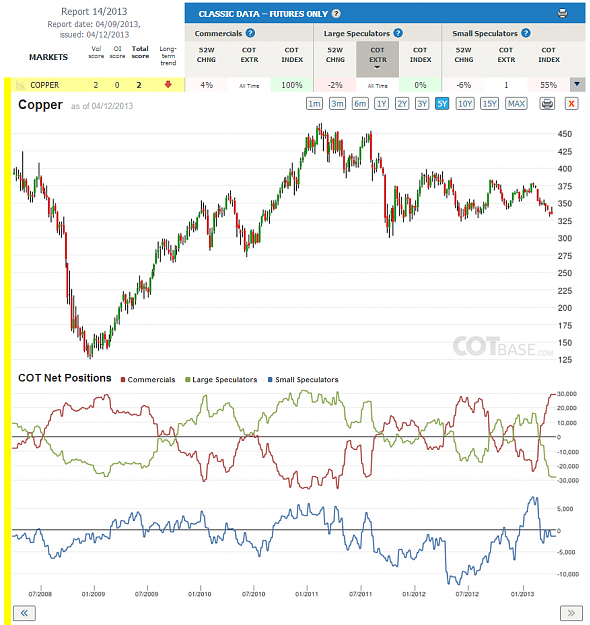
Metals
Platinum & Palladium: COT All Time extreme levels (bearish)
Copper & Silver: COT Extreme levels (bearish)
Gold: Relative COT extreme (bullish), Volume & Open interest score is -11 (bearish)
It is a mixed picture in metals these days… Since these markets strongly correlate with each other, taking the All Time COT extreme signals in Platinum and Palladium and going short would be a risky trade – in my opinion. If the picture in Gold, Silver and Copper where undoubtedly Bearish (for example if Small speculators in Gold were at net long >60.00 contracts) it would be a more comfortable trade. It’s not a question that the long term picture is more bearish than bullish, but the timing of a potential short trade is the key question. As the review tells us, the widening of the cot extreme in Platinum and Palladium could go on for weeks before prices start to react.
I wish all of you good luck to this week’s trading,
All the best,
Dunstan
the original COT report --> here
COT charts --> here
The latest Commitments of Traders review is out (here).
Rough Rice
COT Change (52W) / C-40%, LS-56% /
COT Index (5 year lb.) / C-81%, LS-18%, SS-35% /
I can’t agree with the review this time. Thomas didn’t look at the 5-year chart, which tells us a very different story… This is why I recommend all of you, to always open a longer term chart, besides the default one year, since the cot extreme can only be checked on those. While the one year long chart suggests that a good sell opportunity is in formation, the 5 year long chart shows that we are at a COT extreme. Of course there is no question to the fact that the cot change was large – we may see a decline in prices in the near term (or maybe not) – but on the other hand, the long term picture to me is definitely bullish.
RBOB Gasoline
COT Change (52W) / C-21%, LS-25% /
COT Extreme / C & SS-All Time COT extreme /
Both signals, the COT change and the COT extreme are talking about a bearish picture. Although I agree, I wouldn’t be surprised if this cot extreme widened a bit more. I’ve told you before a couple of times, that COT analysis can be used best, if combined with regular technical analysis. I don’t really see – TA speaking – anything against the continuation of this rally. Consequently I would stay aside until the situation changes, but it’s definitely good to know – and that’s why following the COT report is useful – that stress levels are high in this market.
Metals
Platinum & Palladium: COT All Time extreme levels (bearish)
Copper & Silver: COT Extreme levels (bearish)
Gold: Relative COT extreme (bullish), Volume & Open interest score is -11 (bearish)
It is a mixed picture in metals these days… Since these markets strongly correlate with each other, taking the All Time COT extreme signals in Platinum and Palladium and going short would be a risky trade – in my opinion. If the picture in Gold, Silver and Copper where undoubtedly Bearish (for example if Small speculators in Gold were at net long >60.00 contracts) it would be a more comfortable trade. It’s not a question that the long term picture is more bearish than bullish, but the timing of a potential short trade is the key question. As the review tells us, the widening of the cot extreme in Platinum and Palladium could go on for weeks before prices start to react.
I wish all of you good luck to this week’s trading,
All the best,
Dunstan
the original COT report --> here
COT charts --> here
Attached Image(s) (click to enlarge)