I like your style but I would like to see you use trend lines more. I have news for you regarding not trading breakouts and/or retests - you did one here.
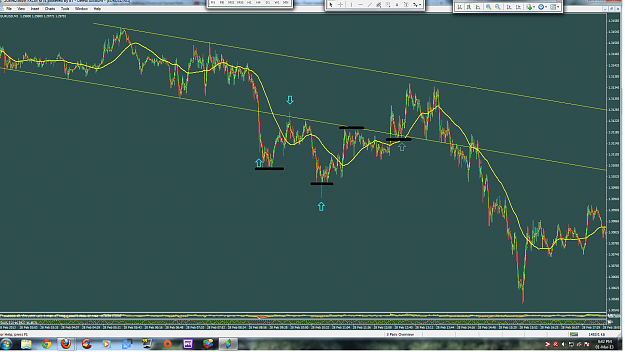
Have a look if you will at this chart. Your first positive trade pin bar (second blue arrow) was arguably a retest of a descending channel from below. Price reacted here to the channel line which thus created the pin bar IMHO. If you had drawn in this channel matching the two highs with the three lows from Tokyo session you could have used it to backup this trade. When price later breaks through this trend line and bounces higher (fourth blue arrow) there is a good chance of a long back to top of channel but I don't think there was a clear signal candle for you there.
Now to the few black lines where you see some of the areas where price has stalled or found resistance/support. Your first trade (looser) had a good signal candle but there was no sign of support around that candle, that support came around 10 pips lower. So would it be worth waiting for 5 or 10 candles of price stalling before taking a trade out in empty space? Your third trade (third blue arrow) which was good has this such support. So as I see it you had a good trade bounce off a channel line, a good trade bounce off found supp/resistance and a bad trade in empty space. The third black line shows your double top which probably kept you out of the pin bar between the tops while the fourth black line with channel line gives good chance of bounce higher. Maybe making more use of S/R lines (you said before you do draw some trend lines) could help you weed out negative pip trades?
Again great vid and excellent trading this week! Keep it up!
EDIT just added chart
Attached Image (click to enlarge)