• Home
  • Forums
  • Trades
  • News
  • Calendar
  • Market
  • Brokers
  • Login
  • Join
  • User/Email: Password:
  • 4:38am
  • Search
Menu
  • Forums
  • Trades
  • News
  • Calendar
  • Market
  • Brokers
  • Login
  • Join
  • 4:38am
Search
Sister Sites
  • Metals Mine
  • Energy EXCH
  • Crypto Craft

Options

Search
Search
Search

Bookmark Thread

First Page First Unread Last Page Last Post

Printable Version

Similar Threads

"Technical Analysis Fallacy" thread people, I need your help 54 replies

The Ultimate Fallacy in Technical Analysis 94 replies

Technical Analysis Fallacy Redux 23 replies

Statistical analysis fallacy 33 replies

  • Trading Discussion
  • /
  • Reply to Thread
  • Subscribe
  • 3,659
Attachments: Technical Analysis Fallacy
Exit Attachments

Technical Analysis Fallacy

  • Last Post
  •  
  • 1 12661267Page 126812691270 3024
  • 1 Page 1268 3024
  •  
  • Post #25,341
  • Quote
  • May 30, 2011 1:13pm May 30, 2011 1:13pm
  •  gart
  • | Joined Jun 2010 | Status: Member | 240 Posts
Quoting fti
Disliked
Oh , is just expression.
i begining hate all these invisible dangers to human life.
We playing too much with all the microbes and invisible forces.

regards
Ignored
FTI great respect for your every word ...
  • Post #25,342
  • Quote
  • May 30, 2011 1:47pm May 30, 2011 1:47pm
  •  tubguy
  • Joined Sep 2009 | Status: Member | 1,227 Posts
Quoting Fana
Disliked
:-). Hi Fti. I am done for today. It wasnt good idea imo to get in... Slow range and i was too big in there... Success, but ugly and tired from that range... so slow...ah.... next time i wont trade holidays.... now i wonder why i did such mistake..
Ignored
Don't feel alone Fana, I played my hand too. Got it slapped! real hard. Glad you came out OK. I had to leave my positions, so placed stops and left. Got hit dead on the pipette!
@142802 exactly. Oh well! I'll be back tomorrow.

Good Trading my friend
Mike
  • Post #25,343
  • Quote
  • May 30, 2011 2:07pm May 30, 2011 2:07pm
  •  Fana
  • Joined Mar 2009 | Status: Member | 1,849 Posts
Quoting tubguy
Disliked
Don't feel alone Fana, I played my hand too. Got it slapped! real hard. Glad you came out OK. I had to leave my positions, so placed stops and left. Got hit dead on the pipette!
@142802 exactly. Oh well! I'll be back tomorrow.

Good Trading my friend
Mike
Ignored
Hi Mike. One day is only one day. Discover what you could do better and try again.
Yeah:-). My generals and commanders was angry with me, because i want it too big...
  • Post #25,344
  • Quote
  • May 30, 2011 2:22pm May 30, 2011 2:22pm
  •  fullperson
  • | Joined Sep 2009 | Status: Member | 420 Posts
ok makes sense, I usually find that 3:1 was 25% retrace on the thread, I'll check again.

How do you use the open candle for direction? I think the TR was used strictly for vol and not direction?

I find that while we should be in the daily direction, the direction changes on the 5 min and 1hr. I tend to put even the daily out of the way and allow 5min's price movement to determine my direction....I bolded that last part because if what I said is wrong, then I need to fix immediately.

Anyways my question was more focused on timewindow. btw my skype is william.fan7 I would really like to talk about the MO

Quoting the redlion
Disliked
i dont know if my answer will be good for you, but this is what works for me so far.

i keep in mind the daily TR, to read volatility, usually my charts are set up for me to see the daily candle as it unfolds....
Ignored
  • Post #25,345
  • Quote
  • May 30, 2011 2:40pm May 30, 2011 2:40pm
  •  the redlion
  • Joined Jan 2011 | Status: Member | 2,680 Posts
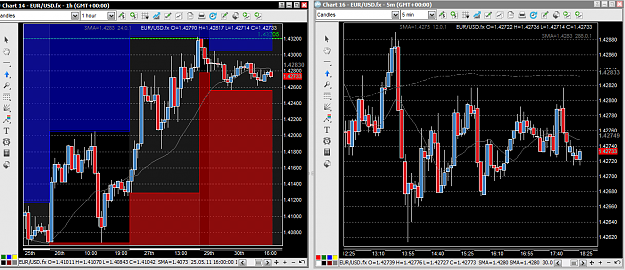
Attached Image (click to enlarge)
Click to Enlarge

Name: split screen view.PNG
Size: 83 KB


to the left is the hourly chart (my brain works in terms of hours)
to the right is the 5 minute ( i dont use the 15 minute, if i count 3, 5 minute candles thats the 15 minute)

the blue area is the daily highs, the red is the daily lows
the green line i plot is the daily open price for reference.
if price is below the open the candle will look red correct?
if price above the candle will look blue.

it helps me know how price is trading in relationship to the daily

if i explained it correctly, you should be able to see, the daily candle unfolding before you

my very faint, gray SMAs (i make them faint so i dont see them unless i want to)
is the houly sma and the daily sma (sometimes helps)
AVT INVENIAM VIAM AVT FACIAM
  • Post #25,346
  • Quote
  • May 30, 2011 3:46pm May 30, 2011 3:46pm
  •  indianguyinny24
  • Joined Jul 2007 | Status: Member | 2,972 Posts
http://www.zerohedge.com/article/cia...ty-intensifies
  • Post #25,347
  • Quote
  • May 30, 2011 4:09pm May 30, 2011 4:09pm
  •  piccolo
  • Joined Feb 2006 | Status: adjust your sails to the wind | 1,354 Posts
Quoting the redlion
Disliked
Attachment 709836

to the left is the hourly chart (my brain works in terms of hours)
to the right is the 5 minute ( i dont use the 15 minute, if i count 3, 5 minute candles thats the 15 minute)

the blue area is the daily highs, the red is the daily lows
the green line i plot is the daily open price for reference.
if price is below the open the candle will look red correct?
if price above the candle will look blue.

it helps me know how price is trading in relationship to the daily

if i explained it correctly, you should be...
Ignored
I hope it works for you.. otherwise you are missing the point and clouding your own mind.
  • Post #25,348
  • Quote
  • May 30, 2011 4:13pm May 30, 2011 4:13pm
  •  piccolo
  • Joined Feb 2006 | Status: adjust your sails to the wind | 1,354 Posts
Quoting tubguy
Disliked
Don't feel alone Fana, I played my hand too. Got it slapped! real hard. Glad you came out OK. I had to leave my positions, so placed stops and left. Got hit dead on the pipette!
@142802 exactly. Oh well! I'll be back tomorrow.

Good Trading my friend
Mike
Ignored
hope is bad for your health in the markets
  • Post #25,349
  • Quote
  • May 30, 2011 4:16pm May 30, 2011 4:16pm
  •  Fana
  • Joined Mar 2009 | Status: Member | 1,849 Posts
Quoting piccolo
Disliked
hope is bad for your health in the markets
Ignored
But our accounts are growing, right?
  • Post #25,350
  • Quote
  • May 30, 2011 4:17pm May 30, 2011 4:17pm
  •  luSan
  • Joined Feb 2008 | Status: Cartographer | 1,981 Posts
Quoting the redlion
Disliked
Attachment 709836

to the left is the hourly chart (my brain works in terms of hours)
to the right is the 5 minute ( i dont use the 15 minute, if i count 3, 5 minute candles thats the 15 minute)

the blue area is the daily highs, the red is the daily lows
the green line i plot is the daily open price for reference.
if price is below the open the candle will look red correct?
if price above the candle will look blue.

it helps me know how price is trading in relationship to the daily

if i explained it correctly, you should be able to...
Ignored
Man, that is very complex.
If you have the sma telling you about PA in relationship to the daily and hourly, what do all these colors do for you?
What is the advantage of counting 3 5M to see the 15M when we just can have the 15< chart in front of your eyes?
I think that less is better.
Cheers.
Empty as water and soft as a facing wind mountain
  • Post #25,351
  • Quote
  • May 30, 2011 4:19pm May 30, 2011 4:19pm
  •  the redlion
  • Joined Jan 2011 | Status: Member | 2,680 Posts
thanx, ill keep that in mind

FTI can correct me on this but i dont think he meant all technical analysis is bad, i MUST have a naked chart.

i think he meant the way people use it to dictate their decision is erroneous.
i use it in a way that makes sense to me. to help me understand my position in relationship to the daily price movement.

im not saying its the best M.O
im still learning, im a beginner and as socrates said " i only know that i know nothing"

but so far i feel comfortable with it, and it works for me.
i trade according to the developing price, that is how i time my entrances and exits, according to what is happening in the 5 minute chart, not only do i keep in mind, patterns, formations etc but also momentum of price.
my scout does well

next i need to know when to hold, and press the attack. not just keep the scout continuously in profit. but as FTI said, i need to tame my ego

i tend to always achieve what i set out to do, and im very bright guy, so i need to be humble with the market, and not force things. go with the flow and take what it gives
AVT INVENIAM VIAM AVT FACIAM
  • Post #25,352
  • Quote
  • May 30, 2011 4:33pm May 30, 2011 4:33pm
  •  piccolo
  • Joined Feb 2006 | Status: adjust your sails to the wind | 1,354 Posts
Quoting fullperson
Disliked
hey guys, was re-reading fti's dance sessions when came across this. I think is insight into use of time window and dow theory. If anyone has insight into this, would be appreciated. Post 6127

-my analysis: don't catch shooting stars, if large position and cannot manage cut out. If manageable and trend still in your position, then maybe ok to attempt rescue if volatility is in your favor. Important to check volatility, to make sure that the previous impulse can be corrected. Seems using some rigid formula? I try not to speculate anymore...just...
Ignored
here is the full quote http://www.forexfactory.com/showthread.php?p=2607149

I think it is a very valuable post. Of course you cannot always expect the waves to develop according to plan or count but you should use it as a guide.
  • Post #25,353
  • Quote
  • May 30, 2011 4:41pm May 30, 2011 4:41pm
  •  piccolo
  • Joined Feb 2006 | Status: adjust your sails to the wind | 1,354 Posts
Quoting the redlion
Disliked
thanx, ill keep that in mind

FTI can correct me on this but i dont think he meant all technical analysis is bad, i MUST have a naked chart.

i think he meant the way people use it to dictate their decision is erroneous.
i use it in a way that makes sense to me. to help me understand my position in relationship to the daily price movement.

im not saying its the best M.O
im still learning, im a beginner and as socrates said " i only know that i know nothing"

but so far i feel comfortable with it, and it works for me.
i trade according...
Ignored
FTI has said many times that you should use indicators like SMA 12 and 48 only when lost. Like if you are asking yourself where is the trend ? (look at daily) It should be obvious even without the SMAs. Where is resistance / support? Is there a tunnel? Try seeing it without drawing first.
  • Post #25,354
  • Quote
  • May 30, 2011 7:08pm May 30, 2011 7:08pm
  •  fullperson
  • | Joined Sep 2009 | Status: Member | 420 Posts
yes, I have printed out the full post, but it is hard to dissect. I do not want to have any bad habits so I wanted to see what everybody's opinion was on ATR and time window before I start practice on this subject.

Also, can you elaborate on the tunnel?

In addition, was still wondering about scope. On 5 min rescues can take entire day and half before daily enforces


Quoting piccolo
Disliked
here is the full quote http://www.forexfactory.com/showthread.php?p=2607149

I think it is a very valuable post. Of course you cannot always expect the waves to develop according to plan or count but you should use it as a guide.
Ignored
  • Post #25,355
  • Quote
  • May 30, 2011 10:33pm May 30, 2011 10:33pm
  •  luSan
  • Joined Feb 2008 | Status: Cartographer | 1,981 Posts
Darn...I am riding my bear going north...
Empty as water and soft as a facing wind mountain
  • Post #25,356
  • Quote
  • May 30, 2011 10:41pm May 30, 2011 10:41pm
  •  imjscn
  • Joined Aug 2007 | Status: Member | 538 Posts
Moody's place Japna AA2 govt rating on review for possible downgrade

@LuSan, nice to see you back
  • Post #25,357
  • Quote
  • May 30, 2011 10:41pm May 30, 2011 10:41pm
  •  tubguy
  • Joined Sep 2009 | Status: Member | 1,227 Posts
Quoting luSan
Disliked
Darn...I am riding my bear going north...
Ignored

Thanks LuSan. I needed a good laugh.
  • Post #25,358
  • Quote
  • May 30, 2011 11:00pm May 30, 2011 11:00pm
  •  Jaro
  • Joined Feb 2011 | Status: Member | 583 Posts
Quoting luSan
Disliked
Darn...I am riding my bear going north...
Ignored
Thanks LuSan!
My account is small, so I need Money!

P.S. Next time you will have mine.
Jaro
  • Post #25,359
  • Quote
  • May 30, 2011 11:17pm May 30, 2011 11:17pm
  •  indianguyinny24
  • Joined Jul 2007 | Status: Member | 2,972 Posts
Quoting luSan
Disliked
Darn...I am riding my bear going north...
Ignored
....

How r u doing lusan...


V
  • Post #25,360
  • Quote
  • May 31, 2011 1:58am May 31, 2011 1:58am
  •  maheswara
  • Joined Aug 2007 | Status: Senior Member | 1,798 Posts
wats with the Asian buying past 1 week , i cant be awake 24 hrs , sigh
To Live is the rarest thing in the world , Most people exist , that is all
Thread Tools Search this Thread
Show Printable Version Show Printable Version
Email This Thread Email This Thread
Search this Thread:

Advanced Search

  • Trading Discussion
  • /
  • Technical Analysis Fallacy
  • Reply to Thread
    • 1 12661267Page 126812691270 3024
    • 1 Page 1268 3024
1 trader viewing now
  • More
Top of Page
  • Facebook
  • Twitter
About FF
  • Mission
  • Products
  • User Guide
  • Media Kit
  • Blog
  • Contact
FF Products
  • Forums
  • Trades
  • Calendar
  • News
  • Market
  • Brokers
  • Trade Explorer
FF Website
  • Homepage
  • Search
  • Members
  • Report a Bug
Follow FF
  • Facebook
  • Twitter

FF Sister Sites:

  • Metals Mine
  • Energy EXCH
  • Crypto Craft

Forex Factory® is a brand of Fair Economy, Inc.

Terms of Service / ©2019