Here's what I am watching today:
GBP/AUD. I use a system taught to me by Rob Booker. It measures time and distance price has been away from the 800 SMA. I have modified it a bit with the inclusion of Pivots Points, Daily Pivot, Weekly Pivot, R3, ans S3.
This is "counter trend trading".
GBP/AUD has been away from the 800 SMA for more than two standard deviations on the 5 minute TF. It would like to visit the 800. On a larger TF this would be seen as a small retrace on a down trend.
The pair is also deviant on the 15 min, and the 30 min.
This usually works out to enter on a higher high after a higher low, with a TL break ( close of candle, no wicks allowed ). When price hits the 800 on the 5 min we usually see a bit of consolidation, perhaps a slight retrace. Then an opening on the 15 min, and so on thru to the 30 min.
What I really like about this setup is that we are close to recent lows, so a relatively tight stop loss can be used, say 20-25 pips below the lowest recent low. With a possible gain of 500 pips, very good R/R.
Where do the Pivot points come into play? GBP crosses have a very high probability of hitting Weekly pivots, and Daily Pivots ( over 90%. This has been tested extensively ) Also, on GBP/AUD,GBP/JPY, and GBP/CHF they have a very high prob of hitting R3 or S3 on Mondays, because the previous day's range ( Sunday ) is usually narrow (gbp/aud has already hit R3.
There are other ways to trade the PPs which I will go into at a later time.
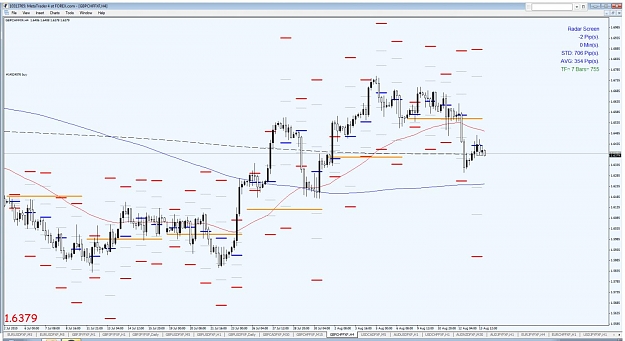
Here are the 5 minute and 4 hour charts:
GBP/AUD. I use a system taught to me by Rob Booker. It measures time and distance price has been away from the 800 SMA. I have modified it a bit with the inclusion of Pivots Points, Daily Pivot, Weekly Pivot, R3, ans S3.
This is "counter trend trading".
GBP/AUD has been away from the 800 SMA for more than two standard deviations on the 5 minute TF. It would like to visit the 800. On a larger TF this would be seen as a small retrace on a down trend.
The pair is also deviant on the 15 min, and the 30 min.
This usually works out to enter on a higher high after a higher low, with a TL break ( close of candle, no wicks allowed ). When price hits the 800 on the 5 min we usually see a bit of consolidation, perhaps a slight retrace. Then an opening on the 15 min, and so on thru to the 30 min.
What I really like about this setup is that we are close to recent lows, so a relatively tight stop loss can be used, say 20-25 pips below the lowest recent low. With a possible gain of 500 pips, very good R/R.
Where do the Pivot points come into play? GBP crosses have a very high probability of hitting Weekly pivots, and Daily Pivots ( over 90%. This has been tested extensively ) Also, on GBP/AUD,GBP/JPY, and GBP/CHF they have a very high prob of hitting R3 or S3 on Mondays, because the previous day's range ( Sunday ) is usually narrow (gbp/aud has already hit R3.
There are other ways to trade the PPs which I will go into at a later time.
Here are the 5 minute and 4 hour charts:
Attached Image(s) (click to enlarge)