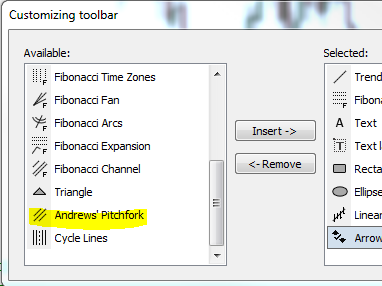
come on, i know what is pitchfork indicator , but i want pitchfork with fib levels, the same as what i attached in firs post
Ignored
Then maybe you should be more descriptive than just saying "I want whats in this picture", plus the picture is not very clear as to what exactly those levels are. It also doesnt help that this is under an RSI title and you switched up the picture yesterday to something different. Some basic common sense seems to be missing, sorry I tried to help.
Then maybe you should be more descriptive than just saying "I want whats in this picture", plus the picture is not very clear as to what exactly those levels are. It also doesnt help that this is under an RSI title and you switched up the picture yesterday to something different. Some basic common sense seems to be missing, sorry I tried to help.
Ignored
yeah you are right
thanks for your help, i dont know any detail about it, but seems it is kind of zup indicator.
This pitchfork is part of the zup indicators, last version I know of is zup_v83. The settings appear to be all off except for the support and resistance static lines. I have never seen a stand alone indicator for this although it would be nice. The zup is mainly for patterns and the user settings are complicated to configure. What I would do is once I have it set the way I want is then save it as a template, otherwise it will take you an hour to reconfigure it. You can search here for it or go to the tsd site to find it, there is alao a pdf out there that can explain some of the settings.
There is also another indicator kor harmonics, you can check out. I don't know if he included the andrew fork in his or not. He has a thread here somewhere also a website you can google.
If you can't locate it I will post the indicator tonight from my other computer.
The Rsi indicator really doesn't look like an mt4 indicator. If you post where you found the chart I will look and see if its jogs something in my dense brain.
If you can't locate it I will post the indicator tonight from my other computer.
Good Luck
Ignored
thank you so much twj1usa
i have zup8 and i have used it before but dont know about its pitchfork , and would be grateful if you know the source or thread help me to know it too
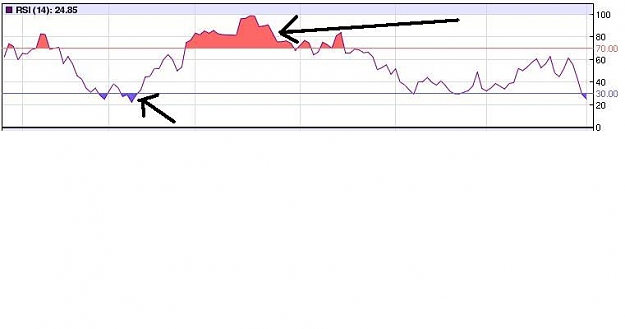
about the rsi indicator you right too, attached picture is from timingchart site and it is not indicator, and i wanted to know is it possible to have it in mt4?
Sorry for the delay got tied up here...kids, school, sports etc..etc..etc..
Here is the version of zup I have and some info on it. I have used it for pattern finding in the past, have not used the andrews or other functions. So I guess you have to figure it out as you go. Not much that I have seen in the past about folks using the andrews in this indicator.
Like I said before I would play with it and then when I have it set up save it as a template. You also have to check the dll function in the first part of the user panel to make it work.
As near as I can tell the andrews is using two sets of a fibo channel inside it. one for support and the other for resistance which form a grid type pattern in the fork.
I may play around with it this weekend, or after kids are back in school and I get back to my normal trading world.
There is several threads on the zups in the forex-tsd forum, the original indicator was in russian so it is hard to interpet. I have included the zup version 82, a short english doc about some settings and two notepad docs translated on the mq4 forum from the original russian version
As for your second question, the rsi indicator. The basic sinple quick answer is it can not be done in mt4.
Mt4 just doesn't draw free form shapes like this, only squares, circles, basic geometric types.
Now I am not an expert coder, but it may be worth looking at the possibilty of making it a histogram using a zero line or a signal line. Like an macd does. Instead of a zero line there could be an 80 and 20 line and then the histogram just shows above/below these two areas. It could be blank inbetween or colored blank between the zero line and the two signal lines. In my mind it sort of works, but then my mind and mt4 sometimes go in opposite directions. I would play with the theory but wouldn't be for a couple of weeks at this point.
Maybe someone more qualified than me has a thought on this one.
As for your second question, the rsi indicator. The basic sinple quick answer is it can not be done in mt4.
Mt4 just doesn't draw free form shapes like this, only squares, circles, basic geometric types.
Now I am not an expert coder, but it may be worth looking at the possibilty of making it a histogram using a zero line or a signal line. Like an macd does. Instead of a zero line there could be an 80 and 20 line and then the histogram just shows above/below these two areas. It could be blank inbetween or colored blank between the zero line...