Joined Mar 2008
|
Status: Lord of the Dance
|659 Posts
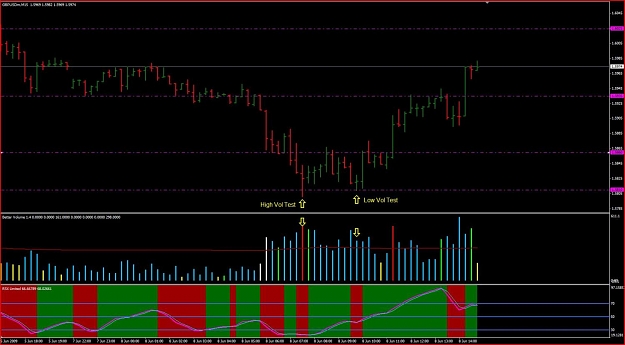
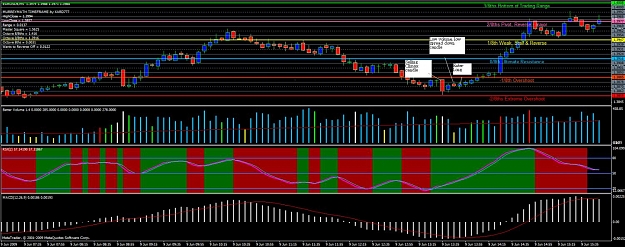
Here is a good example of a high and a low volume test on the 15M TF on GU today.
Testing is a good sign of strength as long as there is strength in the background.
Usually, a low volume test indicates that the market is ready to rise immediately, whilst a higher volume test usually results in a temporary up-move, and will be subject to a re-test of the same price area again at a later time.
Any down-move dipping into an area of previous selling (previous high volume level), which then regains to close on, or near the high, on lower volume, is a loud and clear indication to expect higher prices immediately. This is a successful test. Lower volume shows that the amount of trading that took place on the mark-down was reduced, that now there is little selling, when previously there had been selling. At this point, it is now important to see how the market-makers and specialists respond to the apparent strength seen in the testing.
There was also price diversion on with the RSX indicator with the low volume test.
I use it 90 % of the time . Last week 26 trades 7 losers , and it was a bad week for me . Typically I hit 80 to 85%
I read all the other posts by you .
reality is if you can grow an account 3 - 10% per week you are beating many of the so called bank traders and professional hedge fund managers out there. Most of these traders have NO clue what they are doing . This is why i took my own account into my own hands after a so called professional fund manager lost 35 % of my hard earned cash. I will never trust one of those morons with my money ever...
Ignored
What TF do you use for your trade entries/exits and do you trade 24/7 or prefer certain sessions?
ps. thanks for your contributions to us vsa newbies and thanks to all the other vsa gurus out there.
....EDIT; this was posted by Obaidah in another thread......the following are H1 charts from esignal and MT4 broker, how interesting it is that their volumes data is just the same. (remove the latest bar from esignal chart because MT4 closed before it was formed and compare the data), just look for good data providers.
[u][b]I also made a extensive reasearch on this subject, and I can guarrante to everyone that "most" of mt4 brokers ofers tick volume that is around 80-90% accurate.....
also take a note that the bigger TF you use, the more accurate...
Ignored
FOREXflash,
thanks for the affirmation regarding this issue.
I'll check your new rsx indicator too.
sorry guys but why the wick and better indi repaint? Basically if there are 100 buyers and 20 sellers, the line should remain the same ... why should fall? For me they only increase!
Thanks guys. Question....if we had been in an uptrend and had a buying climax, would I look for a low volume low spread up bar? bascially the opposite of this trade?
No demand bar= low spread, low volume UP bar? Expectation to go down?
No supply bar= low spread, low volume DOWN bar? Expectation to go up?
Is that right?
Ignored
I think the 'no demand' bar has the attributes that you have specified plus the close is middle-to-top of the bar. Being a learner, I would appreciate comment on my thinking from someone who knows. Malcomb ?
No demand bar= low spread, low volume UP bar? Expectation to go down?
No supply bar= low spread, low volume DOWN bar? Expectation to go up?
Is that right?
Ignored
Yes.
For No Demand Bars they dont necessarily have to close at or near their highs but they should be closing higher than the previous bar. (The No Demand bar might even be a red bar).
Also these bars on their own dont mean much. You must always look at the background information.
Remember when reading VSA there are 4 things to look at:
I understand the basics of VSA and also that we need to look in the backround for more information for potential trade setups. I am still having problems identifying the bars associated with volume.
Would someone be willing to create some sort of Quick reference sheet to help us noobs identify these bars? Something basic like this:
Just started reading the VSA BASICS pdf and have a few questions...
It says in there that (I'm writing it in my own words here) Accumulation = ranging market characterized by low volume, narrow spread. The volume should shrink near a support line and expand near a resistance line.
How do you find the support and resistance lines? Or is that covered later in the book?
I understand the basics of VSA and also that we need to look in the backround for more information for potential trade setups. I am still having problems identifying the bars associated with volume.
Would someone be willing to create some sort of Quick reference sheet to help us noobs identify these bars? Something basic like this:
Ignored
I am new too, but I started to look for set ups on chart. It is good for me, although a lot of more exp required.
I picked one of the terms from the glossary, and tried to identify many times on different time frames. You could try, say, shake-out. Have a look at the "Bible" from the Trade guider guys and read the explanation, check the screen shoot. After this you could try to identify it several times.
I did so and first it was just a difficult task. At first for sure. I used all the screen shoots posted here by the smarter guys as excellent references.