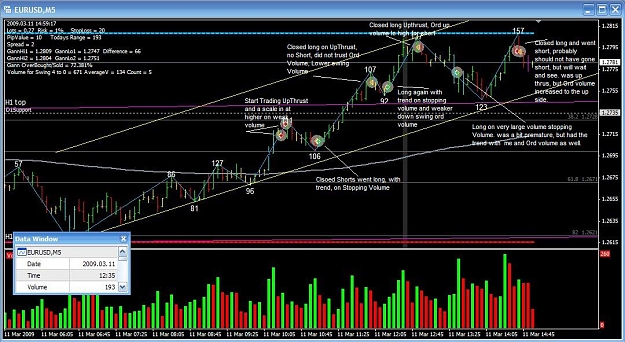
DislikedA few days ago I posted that I'd found a couple of other volume indys. I also said that I would try them before posting. As I personally find them easy to use, here's a chart with both.
The upper one's bars are coloured as per candles and will change colur on higher vols - settings are adjustable. The gold line is a 14 period RSI of the volume.
My charts aslo always have the 50 and 100 sweet spots and often the Daily Pivots - here the red line at 1.3656 is the S1 level......notice how the confluence of this and the 650 sweet spot just happened...Ignored
great chart...have you placed any trades using vsa yet??