Anything is possible. . .
However, if you look at a daily chart is speaks loud and clear, especially the H&S formation. Look at what happened when we fell to 221.06 back in March and then the rise that started from there.
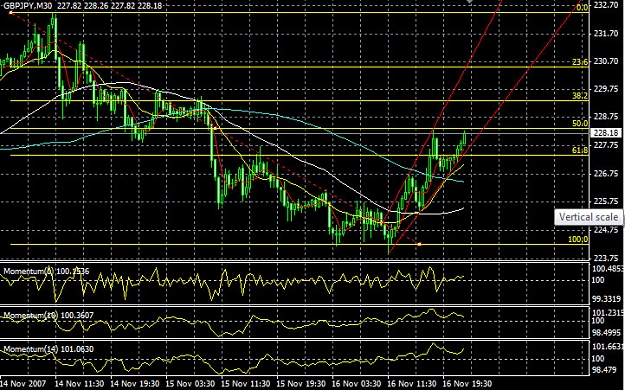
Compare that to last weeks fall and the rise happening from that double bottom. It says there is a potential that we could see 232.99 before we see a reversal, which happens to be the 50% fib ret. from when the fall 1st started (241 to 224).
One last thing notice how it never touched the 50% fib. line. on the retrace from the original fall to 224.18? I think there is some unfinished business there as Gene22 and others have pointed out. . .
231/233 is where I see this thing going before a major turn. . .
Ignored
hi there
can someone explain what the motivation is to go long when the Head and Shoulder is in play on the weeklY? is it simply because of the 50% fib ?
I was hoping it might touch the daily pivot R1 at 228.24 on Friday and turn back
can someone explain what the motivation is to go long when the Head and Shoulder is in play on the weeklY? is it simply because of the 50% fib ?
I was hoping it might touch the daily pivot R1 at 228.24 on Friday and turn back
thanks!
Tina
Ignored
Some of us are long from the bottom of the fall ar'd 224 area, therefore longs would like to ride it until the charts (different TF) signals a reversal.
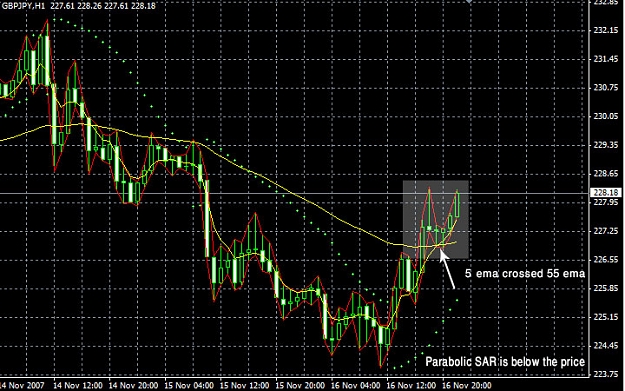
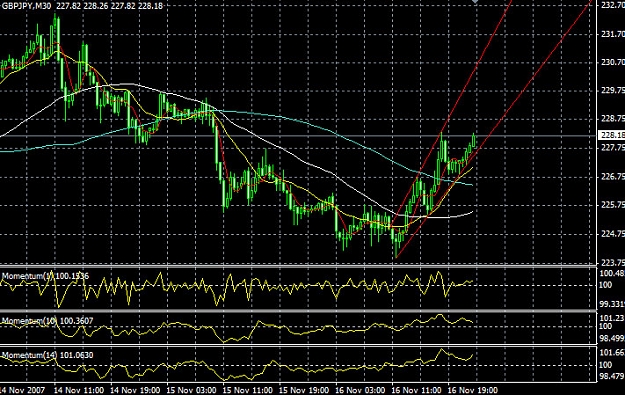
As of now the 1H, 4H and daily all look fairly bullish, we've reached a double bottom from the fall, it looks like it is headed to 228.71, 5 EMA on daily, could test resistance @229.71 on daily, test 38% fib. @ 230.65 on daily, revist 13 EMA @ 231.77 on a daily or make a solid touch @ the 50% fib. on a daily @ 232.70. . . (this is from a bullish stand point). These are all possible senario's depending on how bullish the signal.
On a bearish note, it could have all ready finished its up move and be headed back south to test 222/219 area. (very doubtful of this)
Reason, UJ is in an up move correction and should reach 112.40 maybe 113.30's if and only if it can overcome 111.30 resistance. GU is also in a upmove correction and could go retest 2.0585/2.0620 (heavy resistance).
Or GU could have finished it's upmove and be headed toward 2.0207 area. . . either way that would put GJ at 228.70's-229 on the low end, if GU down UJ up. If GU up and UJ up GJ could go to 231 or 233. . . If both are down then look out below!
so I'll let my long ride while looking for a signal to short when the opportunity permits and will be watching how this all plays out, could play out different ways IMHO. . .
Some of us are long from the bottom of the fall ar'd 224 area, therefore longs would like to ride it until the charts (different TF) signals a reversal.
As of now the 1H, 4H and daily all look fairly bullish, we've reached a double bottom from the fall, it looks like it is headed to 228.71, 5 EMA on daily, could test resistance @229.71 on daily, test 38% fib. @ 230.65 on daily, revist 13 EMA @ 231.77 on a daily or make a solid touch @ the 50% fib. on a daily @ 232.70. . . (this is from a bullish stand point). These are all possible senario's depending on how bullish the signal.
On a bearish note, it could have all ready finished its up move and be headed back south to test 222/219 area. (very doubtful of this)
Reason, UJ is in an up move correction and should reach 112.40 maybe 113.30's if and only if it can overcome 111.30 resistance. GU is also in a upmove correction and could go retest 2.0585/2.0620 (heavy resistance).
Or GU could have finished it's upmove and be headed toward 2.0207 area. . . either way that would put GJ at 228.70's-229 on the low end, if GU down UJ up. If GU up and UJ up GJ could go to 231 or 233. . . If both are down then look out below!
so I'll let my long ride while looking for a signal to short when the opportunity permits and will be watching how this all plays out, could play out different ways IMHO. . .
Ignored
looks like too many possibilities
seems no use for trading
IMO,230 is the highest that GJ can reach.
Reason: GU is in retrace, if 50% retrace, it could reach 2.0595 from last short. UJ is really hard to break 112
if both of them reach that high, Gj will be 230.x
My estimation is bull first then bear will come in play next week
new low will be reached soon.
let's check the charts next week
I must assume you know nothing about the FXManager Trades by Auslanco...
Ignored
How is his account doing? What is the realized loss/profit? I'm thinking of doing the same thing so everyone can see how easy it is to net 5-10% return on their account weekly? Still waiting for oanda to approve my request for a fxmanager acct.
Oanda Closed 228.17 bid on friday, so far it has droped to 227.38. Oanda is a good place to watch for Sunday gaps because their platform never closes, they just widen spreads during week-end, and the price normally starts moving around 1pm EST.
Oanda Closed 228.17 bid on friday, so far it has droped to 227.38. Oanda is a good place to watch for Sunday gaps because their platform never closes, they just widen spreads during week-end, and the price normally starts moving around 1pm EST.