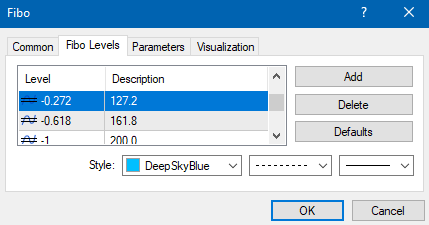
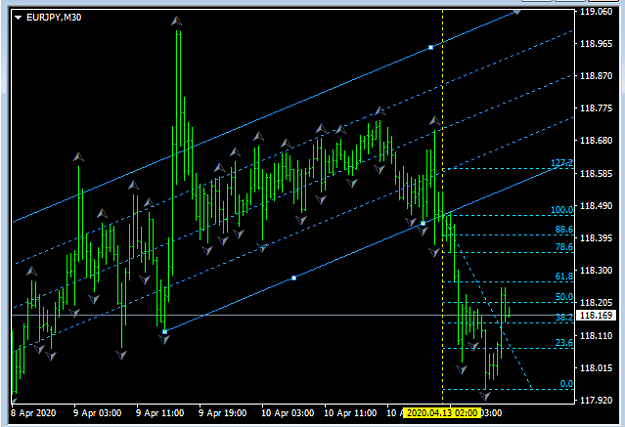
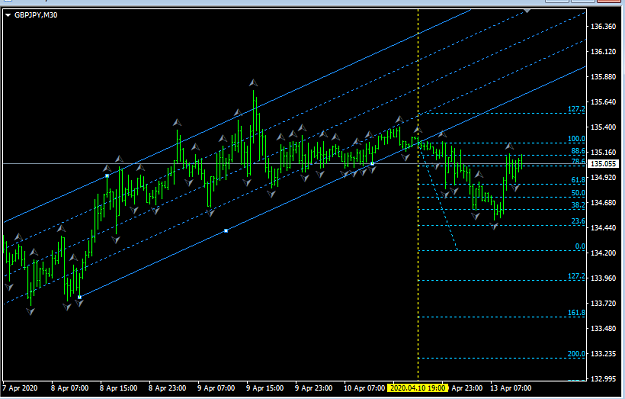
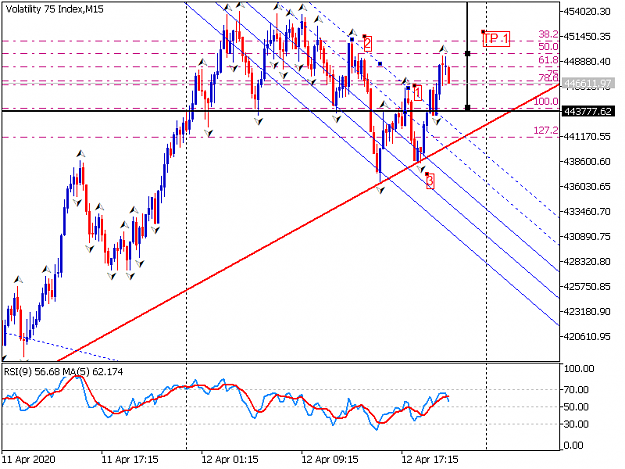
{quote} In the image, please how did you determine the 127.2 level that is above the 0.0 level. It doesn't have the same with as the 127.2 level below the 100.0 level. Thank you.
Friends, any system is not good in itself. And FСP too. I used to write about the advantage that we must find for the model to work. But the biggest advantage is you yourself. You have to become them. If this is not the case, even the best system will bring only losses. Therefore, I do not believe in indicators, I do not believe in ideal systems or the holy grail. I believe in smart people and their experience. This is an advantage.
If I ever hear that said me a more experienced trader, I tried to cling to every word: what he said, what it is, I want to know this. If i didn't know that, I was looking for information, I spent many hours, days, and weeks to find out and try it. Then I either kept it to myself or discarded it.
I say banal things, but can’t say otherwise. There are only 11 pages in our thread now. If you cannot read them carefully, think and understand simple things, then trading may not be for you... I hope this is not so.
Okay, let's continue.
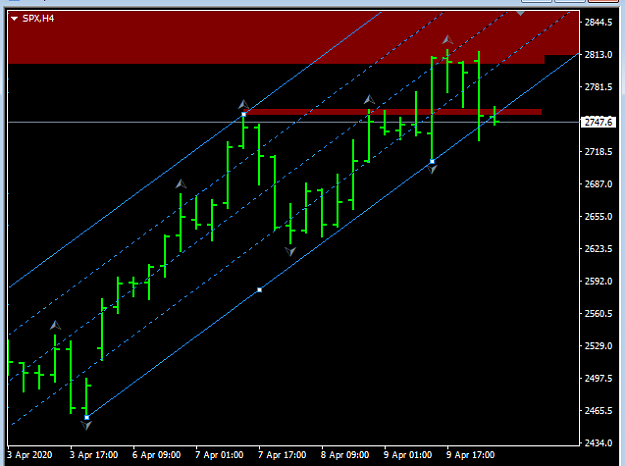
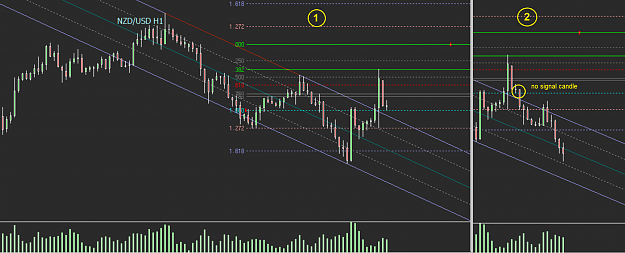
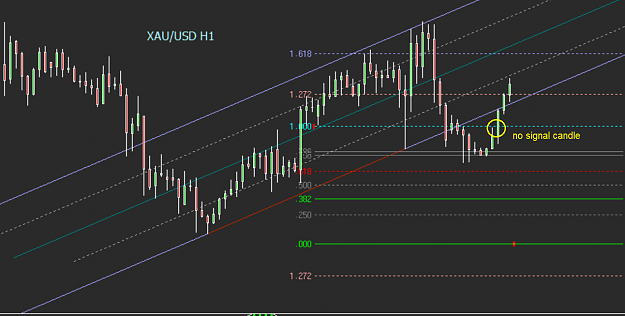
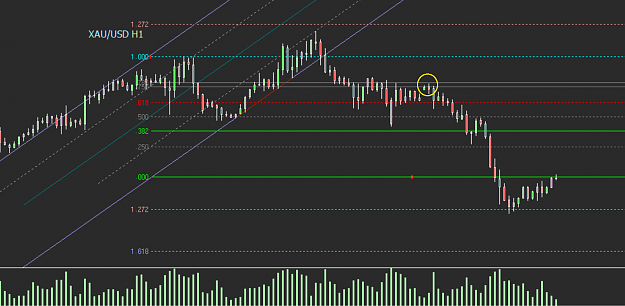
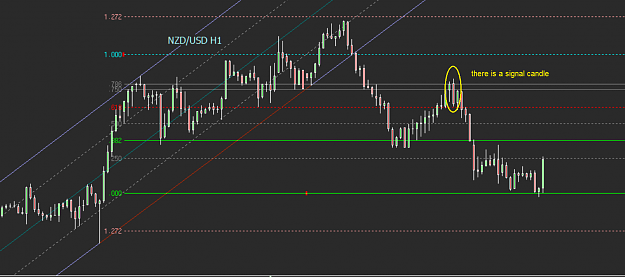
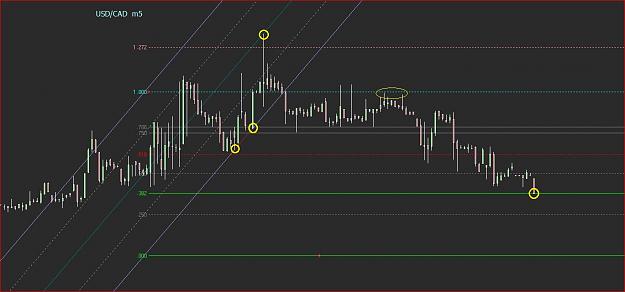
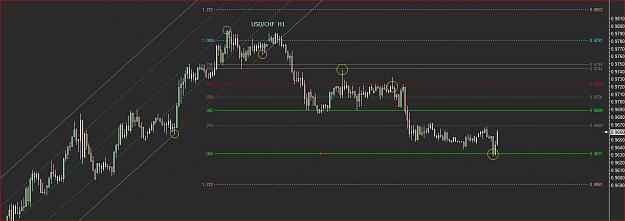
So, we have a channel and a Fibo projection of its width. The fact that the price has broken the channel is not a reason to open a deal. We must look for a situation, where the price rolls back to trigger levels (1.000 or 0.750-0.768) and cannot overcome them. It may look like a pin-bar, doji Heikin-Ashi, candelstick model, failure swing pattern (by Tom Dante) or any reversal signal that you use in your trading system. I always wait for a signal at trigger levels and if it is not there, I will not take a deal, even if the price then rises or falls. What else does it give? Small SL and opening at a good price. On most of my charts here you will see signals to enter at trigger levels. Do not rush if the candle touches the trigger line, wait for the next candle, it is a signal candle for entry. Below are a few "bad" charts. You see that entering too early without a signal candle would be a mistake.
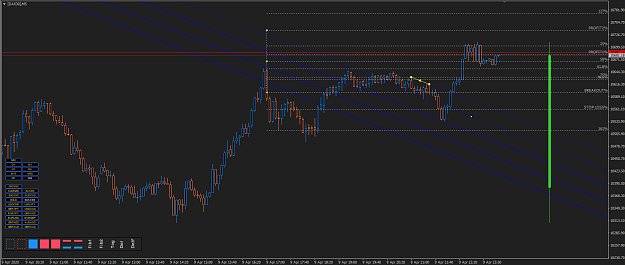
Hi All, This is for anyone who is using MT4 and wants to get the Fibo Channel tool settings right. 1. Draw out the Fibo Channel tool on your chat. 2. Go to the properties of the Fibo Channel tool and use the parameters below... Common : Change the Style setting to a colour that fits your background (I use Red) Fibo Levels : Use levels -0.25, -0.5,-0.75. Change the style color as needed (I use Blue) and I use the dashed line. That is all that is need to use the tool in MT4. Hope it is useful for someone. Thanks. {image}...
Ignored
Very clever adjusting. ( Choosing of the Fibo levels. )
Thanks
Okay, let's continue. So, we have a channel and a Fibo projection of its width. The fact that the price has broken the channel is not a reason to open a deal. We must look for a situation, where the price rolls back to trigger levels (1.000 or 0.750-0.768) and cannot overcome them. It may look like a pin-bar, doji Heikin-Ashi, candelstick model, failure swing pattern (by Tom Dante) or any reversal signal that you use in your trading system. I always wait for a signal at trigger levels and if it is not there, I will not take a deal, even if the price...
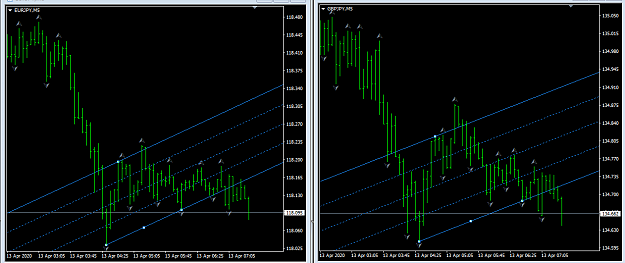
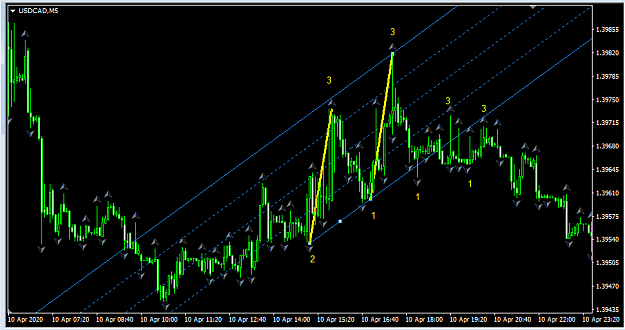
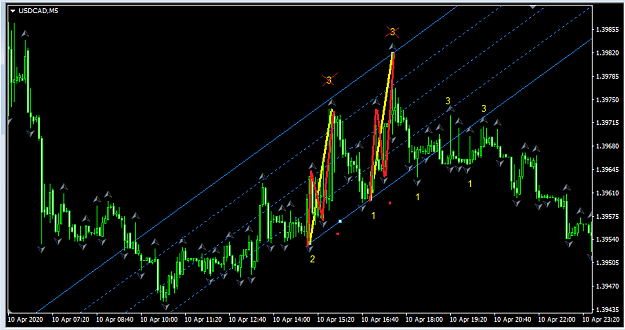
hi there, is it a must for point 3 to only coincide with the mid channel? or it can coincide with the last line too? also, how do you draw a perfect channel whereby point 3 coincides with the mid channel, i tried doing it with mt4 but it is not accurate... thanks {image}
hmm ... first time i encounter where the 2nd point 3 is higher than the 1st point 3.
maybe Seysin can answer.
not so sure. a bit discretionary. the difference is not much.
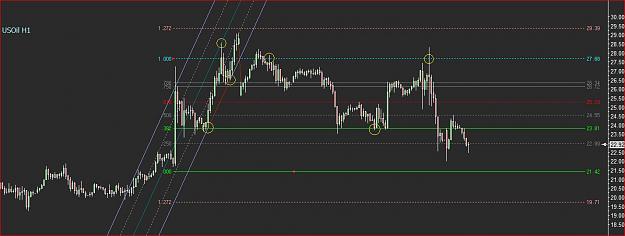
personally i prefer to see the latest point 3 to be lower than the previous peaks. this is to show that the momentum going up is slowing, in which case point 1 has to be shifted to the right
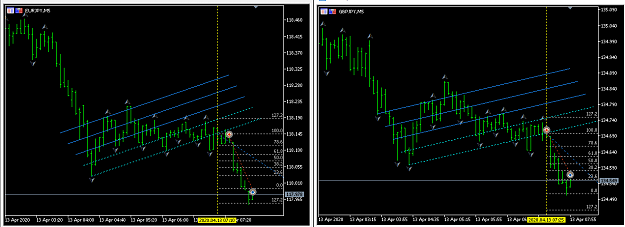
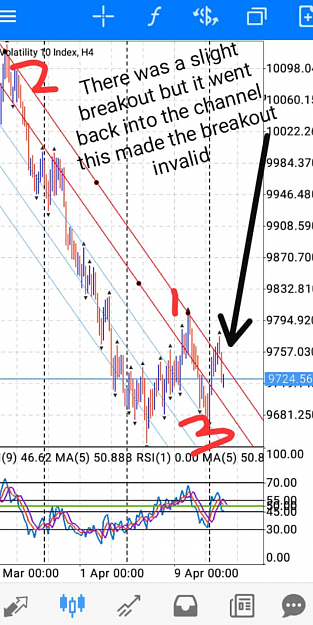
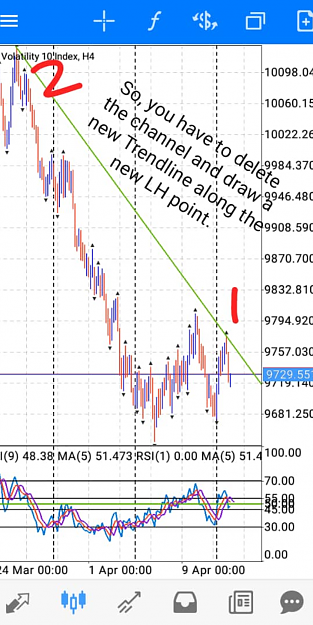
{quote} ...personally i prefer to see the latest point 3 to be lower than the previous peaks. this is to show that the momentum going up is slowing, in which case point 1 has to be shifted to the right {image}