{quote} Yes, of course, Fibonacci Tool is universal across every trading software; but we're not using Fibonacci numbers, just use the Tool to measure the range and project the targets. I have posted the settings a few times, just scroll back to find them. Good luck
Ignored
Ok, I've seen the settings. I've read every page on the thread. I have a EA that runs this method but it's mainly just the thread starters rules. It's not as flexible as it should be yet. It's basically a beta version. It plots the trades for you but I was wanting a "template" i could use that would just load the Fib for me, instead of having to open up a Fib tool and measure the H and L of Mon and Tue for every pair and have to also go inside the properties and change the Fib's to what I want on all of them.
{quote} Ok, I've seen the settings. I've read every page on the thread. I have a EA that runs this method but it's mainly just the thread starters rules. It's not as flexible as it should be yet. It's basically a beta version. It plots the trades for you but I was wanting a "template" i could use that would just load the Fib for me, instead of having to open up a Fib tool and measure the H and L of Mon and Tue for every pair and have to also go inside the properties and change the Fib's to what I want on all of them.
Ignored
Once you make the Fibonacci Tool settings, you shouldn't have to change on every pair.
If the Fibonacci is already there, delete it, and reapply with the new settings, we don't need to do this until Wednesday, usually the high and low are fairly obvious at that point.
It's hard work for sure but there will be rewards
Good luck
If you trade like me, you'll be homeless and broke within a week.
{quote} Ok, I've seen the settings. I've read every page on the thread. I have a EA that runs this method but it's mainly just the thread starters rules. It's not as flexible as it should be yet. It's basically a beta version. It plots the trades for you but I was wanting a "template" i could use that would just load the Fib for me, instead of having to open up a Fib tool and measure the H and L of Mon and Tue for every pair and have to also go inside the properties and change the Fib's to what I want on all of them.
Ignored
Are you referring to using the Fib tool to calculate the high/low/entries etc.? If so, you don't need it as we're not using Fibonacci ratios here - we simply use the tool to scale the lines for the chart.
{quote} Hi Erebus! I'm thinking of using currency strength indicator on Wednesday to see the strongest and weakest currency as set up. What do you think?
Ignored
Absolutely, I always watch the strongest vs weakest
If that pair or pairs is moving, and there is a price entry level, S/W is great confirmation
Good luck
If you trade like me, you'll be homeless and broke within a week.
{quote} Once you make the Fibonacci Tool settings, you shouldn't have to change on every pair. If the Fibonacci is already there, delete it, and reapply with the new settings, we don't need to do this until Wednesday, usually the high and low are fairly obvious at that point. It's hard work for sure but there will be rewards Good luck
Ignored
Thanks. I'm working on it now but it's not seeming to line up the High's and Low's of the 2 days I selected. I'm using last week as a guide to set up the Fib Tool and save as a template. I have all the levels charted and named but when i switch screens it changes the High's and Lows. Something is not right. I'll keep trying though. Thanks for your help.
Edit: I'm trying to use the Fibonacci Tool that is provided by MT4 under the "Insert" tab at the top. I'm using the Fib Retracement. I will start looking for an idicator that might be able to plot these levels as well that is easier to use then MT4's. I know i'm not the sharpest knife in the drawer, but i'm also not the dullest...lol.
Edit 2: I just realized that using that tool provided from MT4 it will not save to a template. Back to square 1.
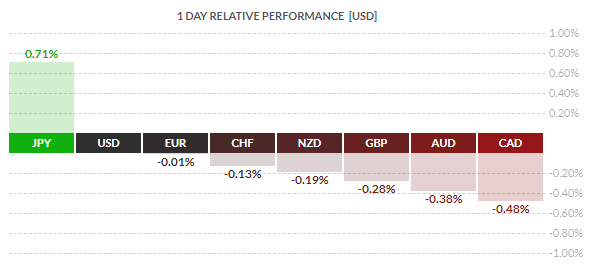
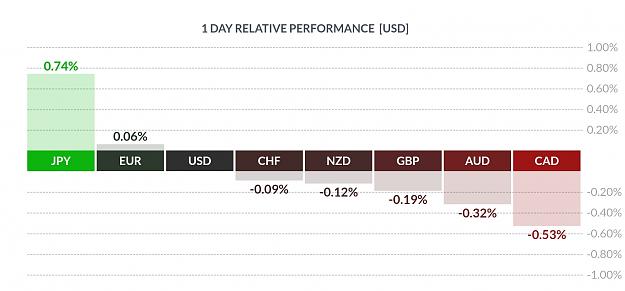
Very very early strength readings, Frankfurt, Mon open Don't be seduced by those devilish indicators Be strong and patient for Wednesday {image}
Ignored
Sorry Erebus, but what CSM do you use to get this nice graph? I assume this is showing USD to be strongest and NZD to be the weakest thus far this week when you used it?
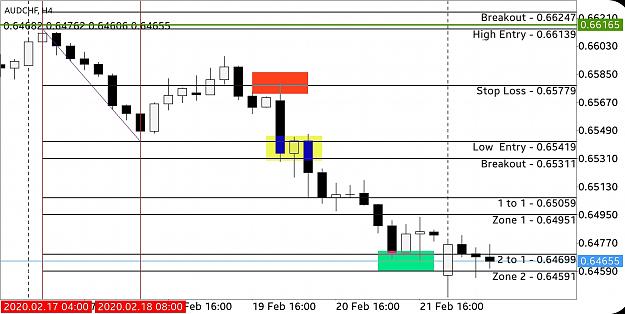
Not seeing a lot of effort here people I will post another example of visual backtest and a trade that could have been made last week, and I can do this on a small phone screen. AUDCHF, Monday 17 and Tuesday 18, vertical lines to display the high and low Apply the Fibonacci Tool, yellow box is the entry area, there are 3 x 4 Hours candles there, enough time to think and ACT? Place the stop loss area at red box, have the Take Profit ready in place at the green box First to post an example, win, lose or BE, wins a Snickers bar {image}
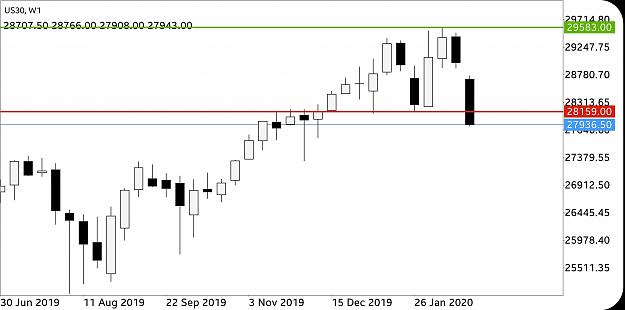
If this was the performance late thuesday evening, and you are about to choose pairs to set entries on. What pairs would you look at?
Go for the most movement or how do you guys choose?
If this was the performance late thuesday evening, and you are about to choose pairs to set entries on. What pairs would you look at? Go for the most movement or how do you guys choose? {image}
Ignored
Choose your pairs before anything else, or just the 28 as I do, then it's all about the
PRICE , PRICE , and PRICE
Only price can give the entry, it's not about which pairs, still another 24 hours to learn.
Good luck
If you trade like me, you'll be homeless and broke within a week.
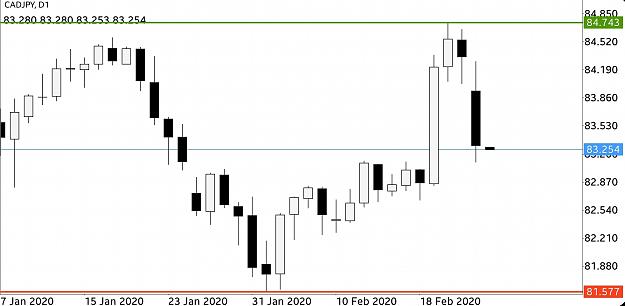
This is my weekly visual review, using basic 1 unit risk, take profit at 2 units, resulting in a +27 units increase. Feel free to challenge any chart, I'm ready Let's go live next week, I've got the free time now, getting over my bear attack Hang on , file is too big? Working last week Had to make 2 files {image} {image}
Ignored
Hey man, how come my spreadsheets don't look like that? I like that format.