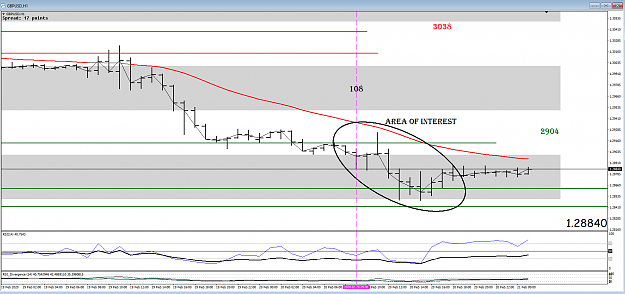
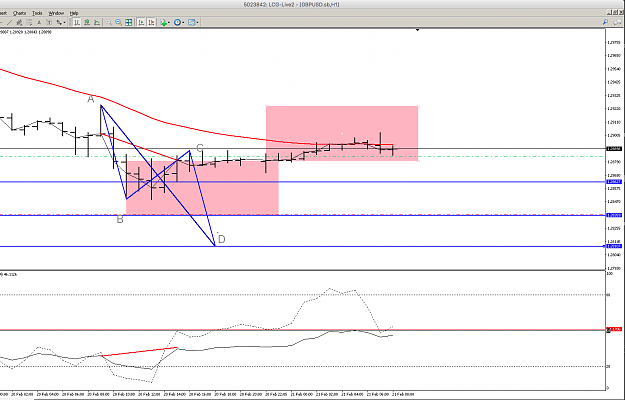
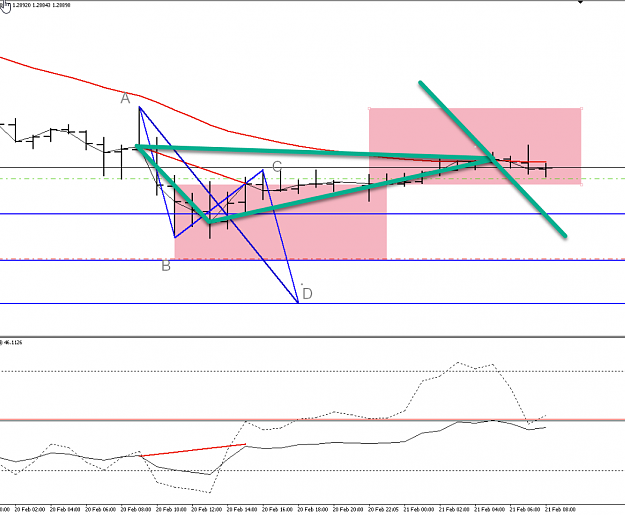
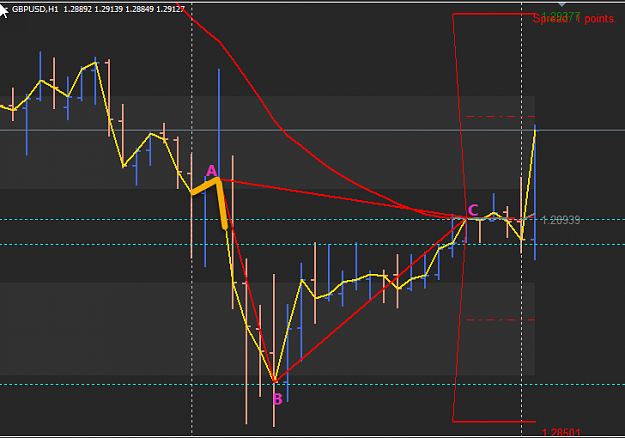
DislikedThis is as far back as I can go with my 60m chart. Look how the price has reached the next 60m EMA low on the far left of the chart (long blue Horizontal line) and by doing so the price has dragged the EMA down to the next low (short blue horizontal line) on the right side of the chart. I can't get any further back on my chart so absolutely no idea where the next EMA low is on the 60m. However, looking at the 240m the next EMA level is a long way down. Please note I too am not the guru here! {image}Ignored
Trading S/R with PA only. No indicators anymore!