OK, I withdraw this statement. I correct.....
I am a basket trader. And if you trade all of the signals shown, you win at the end of the day. Point.
So your telling me with this system you never have a losing day?
Please explain more. Also some proof of this would be nice. How many days have you been trading with this? What are your results? I have also tested basket trading and it can work well if you know what you are doing. It is never a bad idea to have different positions running to limit risk and decrease the time it takes to become profitable. The problem becomes though, when you close your trades too early. If you take profit too fast on trades then you risk decreasing your chances of finding another high probability basket. This can become hard to balance and since FX does not move that much anymore its best to hold on to your winners, how do you manage this? I assume by saying you win at the end of the day you mean you are closing positions each day and re-entering more every new day. What about sideways days? Days when the market does not move much at all, or retracement days?
So your telling me with this system you never have a losing day?
no, sometimes not a winning day
How many days have you been trading with this?
live since 06/25/2019
What are your results?
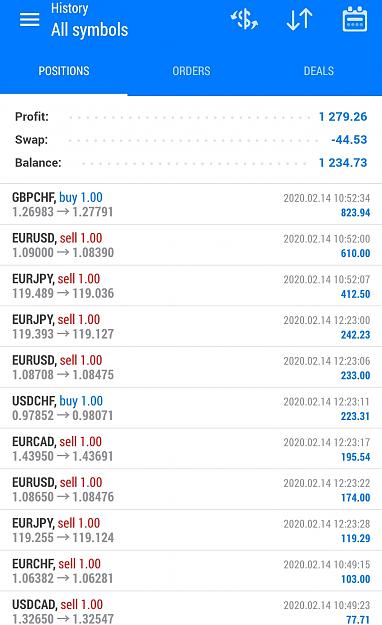
from 600 to 2668 EU
I assume by saying you win at the end of the day you mean you are closing positions each day and re-entering more every new day
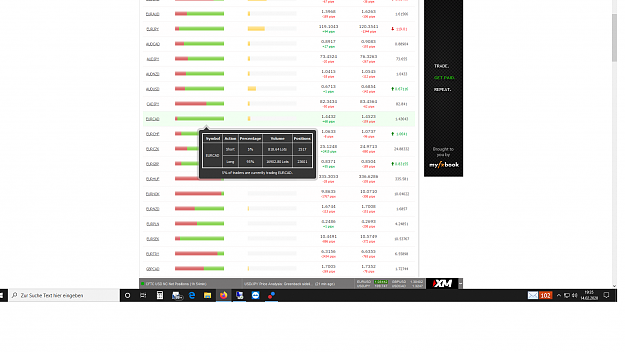
no, expressed unhappily. TP is 1 percent. no trade is closed beforehand. stake is 0.01 / 500 EUR
What about sideways days? Days when the market does not move much at all, or retracement days?
see explanation 1
three red lines. I traded lines 1 and 2 with SL. was a stupid decision. SL doesn't need a person. third line i did something different. was stupid too. otherwise, no loss days
Impressive results. That's over 400% in 14 months. Around 30% per month profit. Very impressive. I'm sure the signals come from a properly coded system that took a lot of time to develop. My only issue with it is the risk. Since you started with a low balance I assume you are comfortable with it though. I would recommend lowering your risk since your draw-down of almost 70% is pretty risky, and trading with this much risk is not going to work long term, but congrats on growing your account to this point. It's going to get much harder from here to make consistent gains trust me.
30% per month return is very impressive and if you choose to use this software to pick your trades for you that is fine, but I still think that picking your own trades based on your own analysis will prove to be more fruitful in the long run, maybe one day you will agree with me.
Thanks for your comments, and good luck in your continued success, hopefully you will keep us updated here.
Really? I thought you were trying to learn what to put on your naked chart so you would know how to trade.
Oh, yeah man you totally caught me. That's exactly why I made this post.
Quote
Disliked
There is 0.00% chance you can gamble on a naked chart and out trade me, LOL. That's hilarious.
No one is gambling here, I use my charts only for entry points, as I stated multiple times here. I study how the Forex market is currently moving and current economic factors to build a case for myself before entering a trade. I believe strongly that it is important to understand these basic things before looking for entries.
Quote
Disliked
Your fundamental approach is worthless against intraday price cycles. Trying to trade the next trade, based on the high/low of the last trade, indicates you know nothing about graphs and how to use the plotted data to project future movement. It's called Statistics, and involves determining the probability, or odds, of the future.
Who said I trade intraday price cycles? You don't even know me or my trading method yet you assume I know nothing and that I am here to steal indicators to trade with. There are many ways to trade and make a profit, I choose not to use indicators. Your seriously going to act like there are no successful traders or fund managers who don't use indicators? lol to YOU.
[quote]If I showed up to a client to explain his expenditures and profits, and the future projections of them, with a naked chart, LOL, I would be tossed out like a drunk in an old west saloon. Naked charts, LOL. I guess in a way I trade naked charts too, since I do not even use candles. My charts are blank, lol. Still wanna play?[quote]
This isn't a dick measuring contest. If you are successful at what you do then good on you. Instead of trying to embarrass yourself why don't you try and prove me wrong? Price moves regardless of what indicators you use.
Essentially, that early stage (initial) Long sided rotation that I spoke about two sessions ago has entered a more mature phase. The Harmonics component of this served its purpose as a confirming event. The Panel looks a bit more Green at this stage as it should. Many of the H4 elements within the Panel found "religion" and have "converted." This trade is functioning and behaving as my first post about indicated. Rough, rocky, not for the faint of heart was well understood from the moment the trade was first posted. So, its journey so far is not unexpected. You were told that patience was required from the start and you were told the market would go down below the entry before stabilizing. You were told after day one and the extension of the B2i structure that the position had converted itself into a Swing Trade. So, essentially, everything expected to happen has happened up to this juncture. What next?
What's next is an explanation for why the trade moves slowly. For the benefit of the New Traders (which is the only real reason why I'm on this board in the first place), I'll break this down in to some of the individual concepts that explains this trade, starting with this view of the Market:
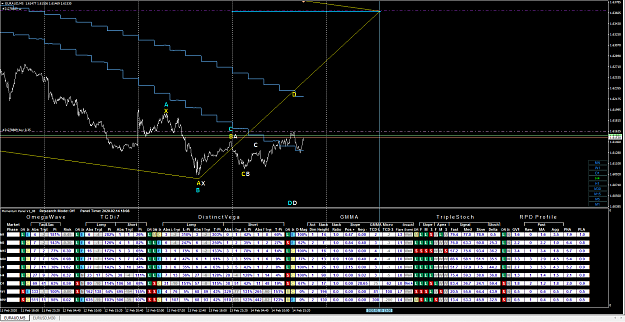
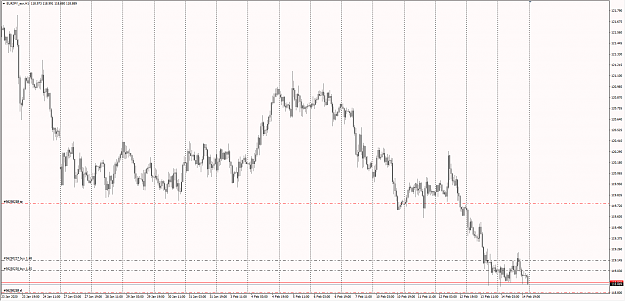
Naked H4 Solo View
Attached Image (click to enlarge)
One of the most important things required for a comfortable trade is to know which Time Frame is in "control." That's not to say that "Time" itself controls the market. However, the market's key influences and behavior will shift through different Time Frames depending on where the Market is within its own (if you will) Price Cycle.
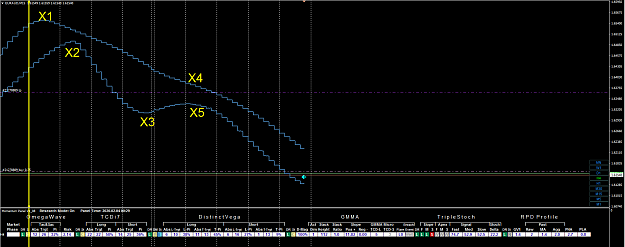
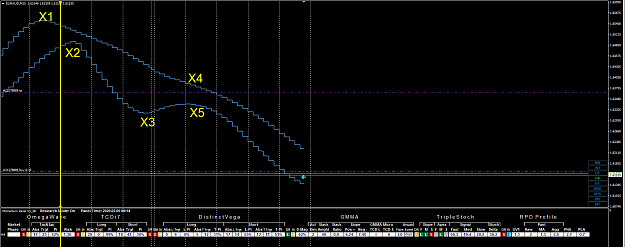
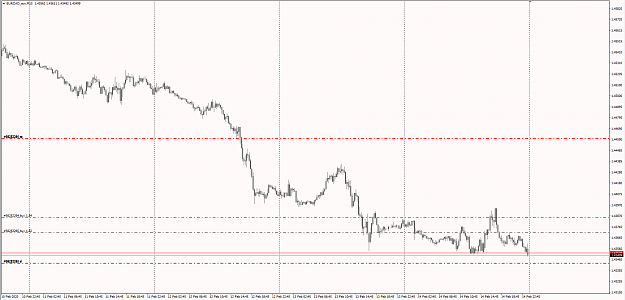
For the EURAUD, the "controlling" time frame has been H4 since the precise moment of "X1" in the pic. From X1, each pic there after shows a yellow vertical line. That yellow vertical line depicts what the System was showing in the Panel precisely at the time shown by the yellow vertical line. The observed chart time frame is M15. So, this chart shows X1 through X5 over the past 10 trading sessions:
"X" Marks the Spot
Attached Image (click to enlarge)
Attached Image (click to enlarge)
Attached Image (click to enlarge)
Attached Image (click to enlarge)
The yellow vertical line showing the System's output is placed at the start of each trading session and before the "X" event takes place in the real market. Looking at the output from the System at each event, it shows what the H4 Time Frame had in its mind.
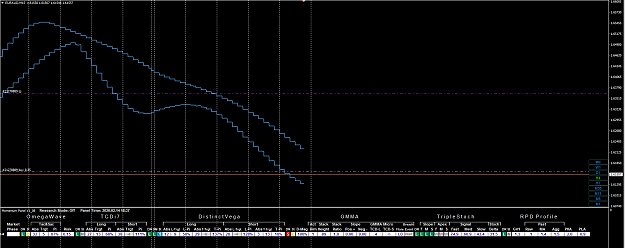
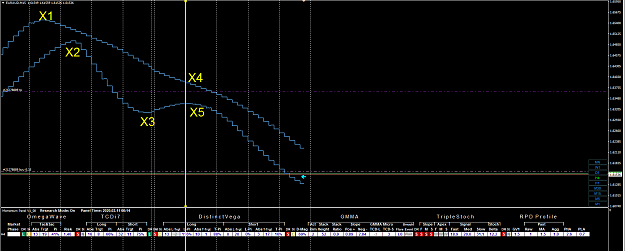
Though I have isolated the H4 Time Frame from the System here, this "naked" chart is M30 and the Indicator (Blue in color) is a Multi-Time Frame Composite version of the GMMA Indicator seen in the Panel. So, this is an H4 GMMA shown on an M30 chart. However, this is not exactly the same GMMA that Daryl Guppy originally created. This is a modified version of that same Indicator. This version uses a different averaging method and the inputs to this version of the Indicator are Harmonic. So, the Indicator uses its own calculation and the inputs to the moving averages that derived the Indicator are separate Harmonic calculations that I've created expressly for this particular Indicator. So, this produces GMMA Moving Averages that take as input two different Harmonic values - as opposed to just using random numbers plucked from air as the Moving Average inputs. Those twin Harmonic Numbers are, of course, classified information. I have never revealed them and I never will.
What these Harmonic values do to this particular modified version of the Daryl Guppy GMMA Indicator, is they put the GMMA in in "frequency" with the market in a specific Time Frame. So, the Value of the Time Frame, in this case the number 240 (240 minutes [H4] in a D1 trading session), was used in a calculation along with two certain Fibonacci Numbers to produce the final inputs to the Indicators Moving Average output. That places GMMA in "frequency" with the market within the Time Frame used to output the data from the Indicator. All GMMA outputs in the Panel have their own unique Harmonic formula bespoke to the Time Frame in which they exist. Enough about GMMA.
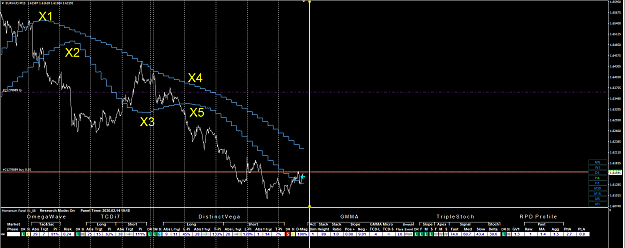
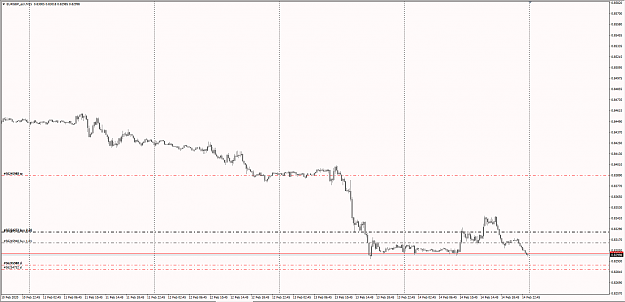
Simply observing the Composite version of the GMMA structure on this M30 chart, it becomes quite clear WHY there was so much downward pressure in the EURAUD market. However, adding the Line Graph back to the chart and looking at each GMMA event (denoted at each yellow vertical line), you can see here how the market reacted at each "X" event:
Adding Price Line back to M30 Chart
Attached Image (click to enlarge)
Quite clear and fairly precise. And this is just one Time Frame using just one Indicator in the System. One can clearly see that it was indeed the H4 Time Frame that was in "control" during this particular Market Phase. "Control" will shift when the Market decides to shift control to a different Time Frame.
The System has no "control" over which Time Frame is in "control." The Market decides that. The System was designed and later configured to detect which Time Frame is in "control." And, this is the entire point of this particular post. As a New Trader, no matter what Tools you deploy in your trading, it is of paramount importance that you figure your own way for detecting the "Controlling" Time Frame. This is how I roll. This is how I now do it. Your approach will be different than mine. That's ok. Just as long as you make the conscious effort to include some method of detecting the "Controlling" Time Frame into your trading.
The next step is to find a way to figure out when Rotational Influence is coming into the Market, so that you can have the opportunity to flow with the Market as its energy begins to change direction.
I could extend this concept further, but I think this is probably enough new information to digest for the New Trader. Just keep in mind that YOUR methods for doing this will vary. But, at the end of the proverbial day, we ALL have to do it. We all have to gain an understand of which Time Frame has Dominance and WHY.
{quote} Impressive results. That's over 400% in 14 months. Around 30% per month profit. Very impressive. I'm sure the signals come from a properly coded system that took a lot of time to develop. My only issue with it is the risk. Since you started with a low balance I assume you are comfortable with it though. I would recommend lowering your risk since your draw-down of almost 70% is pretty risky, and trading with this much risk is not going to work long term, but congrats on growing your account to this point. It's going to get much harder from...
Ignored
Thank you for the nice words. I dream of an EUR 50,000 account. and every day 1 percent profit ..... I'm humble ......
{quote} Nice. Keep at it, looking for ways to improve. Of course, on the other hand, if you are satisfied, then don't. As for me, I think June 20th and November 27th were non profitable days. I think I lost 7 pips one slow day in June, and a little over 3 pips on the day before Thanksgiving. Other than that, I generally average 36-58 pips per day over each of 8 pairs, about 375 pips a day on yearly average. Two slow trading days basically account to nothing, and if the market cannot beat the spread, lol, there is simply nothing I can do to improve...
Ignored
Thank you for the nice words. I dream of an EUR 50,000 account. and every day 1 percent profit ..... I'm humble ......
JetTrader I refuse to believe that you misunderstood what I meant by my statement.
Ignored
You asked for Trades. You got them. Yours was an Publicly Open Challenge. That challenge was responded to on the merits. You got two trades. One was a Day Trade and is now closed with profit. The other converted itself to a Swing Trade and remains open until it surrenders profit.
Your OP made a very good point, especially for New Trader. I come here for the New Traders. I know what they suffer through. I was a New Trader 17+ years ago trading options strategies and getting my hat handed to me on a routine basis until I learned how to Spread Trade. It was not easy and it took a lot of work. However, I had a very good Mentor. His name was George Fontanills, one of the founders of Optionetics and one of the first to educate the public on how to correctly create successful options strategies. I never misrepresented nor misunderstood anything George, taught me. And, George, never misrepresented nor misunderstood anything I've ever shared with him directly. So, I don't have a history of misrepresenting or carrying forward as (fact) that which misunderstand.
The OP asks the question: Why do traders use so many indicators?
This is a very valid question, whether it was meant to prove the use of indicators a fallacy, or whether it was meant to honestly demonstrate that trading without them is possible. It never mattered to me either way. You took the Con and I took the Pro side of the question. That's part of the reason behind having a Forum of Discussion about Trading. Mine was to show the reasons why I use Indicators and to show the distinction and differences between Indicators and an Integrated Trading System. That process is still underway as the current trade using an Integrated Trading System remains open.
{quote} Brilliant idea! I believe that indicators can be used to trade profitably, but before one can do that, he would have understood the Dynamics of markets. VIPTRADING kindly share how one can trade without indicators, so that struggling traders can learn the basics here. Thanks
On point, however. It is not really a "naked" chart when it has Candlesticks on it. Candlesticks are an Indicator. People tend to forget that. They show OHLC and the absolute range of each bar in isolation. That's an Indicator by any definition. A true "Naked" chart would be Price Line Chart and nothing else. Along the way, I began showing the New Trader, how layering Indicators on a simple Price Line Chart can enhance the trading experience when done right.
Nope. One does not need Indicators. However, if the Indicators actually indicate something useful, they can only help.
{quote} I used to use the weekends to identify where the vertical movement of price actually began and ended on each trade. Then I looked for ways to target those specific trades, while simultaneously being able to ignore the garbage movement in-between them. If you can learn to do that, it should significantly reduce draw down to nearly non-existent, and increase your win/loss ratio to achieve more consistency, so you can increase risk. I will give you a hint on how I did it. The bell curve is my secret to trading wealth. I figured out how to independently...
Ignored
The bell curve is my secret to trading wealth. I figured out how to independently employ two of them against the range of motion of price cycles, and then applied it to multiple time frames. My head is spinning. 😉😊😊
{quote} I agree. It is actually in the arena of Quantitative Analysis and that form of math is new and not well known. It relies heavily on identifying control limits so you know the make or break points of future data projections. It started as a way to determine how many supply ships to send to Europe during WWII, and how many to expect to arrive unharmed. It might be difficult for the average person to convert its use to trading graphs. I removed it for you.
Ignored
I already copied, lol. Is it kind of Standard Deviation thing??
{quote} Exact same sentiment to you. Next time however, gain and understanding of what you don't yet know before having an opinion about it. I'm still waiting for you to do what the OP asked: Show a trade.
Ignored
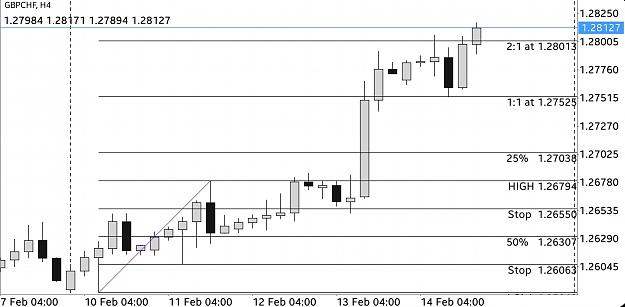
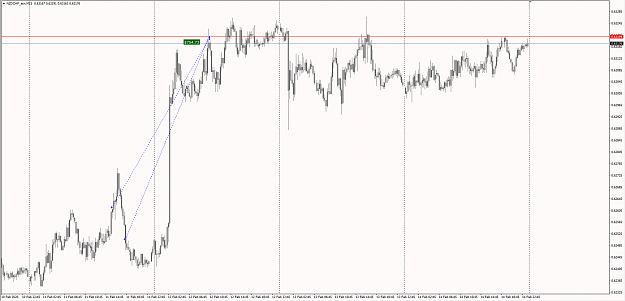
I haven't got a dog in this fight and this is only DEMO but it's all I've got to show, chart below, entry can be at break of Tuesday HIGH or at +25%
Glad to see that you agree that indicators are not required, I urge you to reconsider even the need for timeframes, trade price alone.
Cheers, have a great weekend
Attached Image (click to enlarge)
Attached Image (click to enlarge)
If you trade like me, you'll be homeless and broke within a week.
{quote} Exact same sentiment to you. Next time however, gain and understanding of what you don't yet know before having an opinion about it. I'm still waiting for you to do what the OP asked: Show a trade.
Ignored
Show a trade....hmm.
Some running, some closed.
All have identical entry criteria based on indicator shown on charts.
No shooting from the hip.
They either run to profit or hit stop loss. It happens, big deal.
I'll get back in at a better value price.
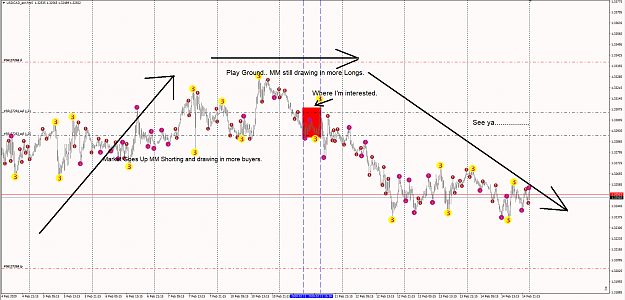
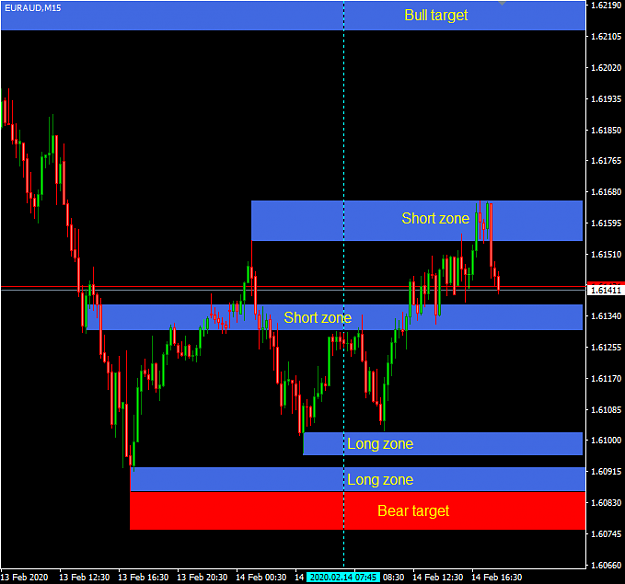
{quote} Here is what the indicator based system tells right now. Potential intraday trades indicated by the zones. Those zones are calculated by tools(not supdem or SR indicators) that will update itself with each in-coming tick. The picture shows only the manually drawn levels aspect of analysis. I don't trade EA btw. {image}
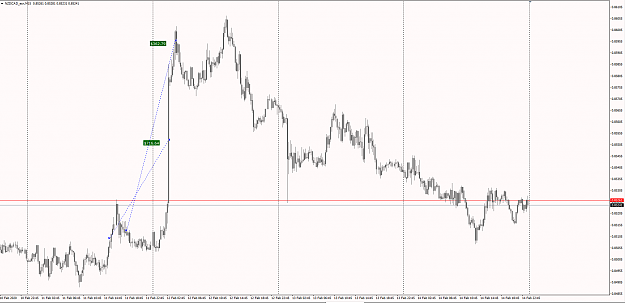
{quote} One final point about day trading EA today. The math formula tool right now says that the higher probability trade is to look for long opportunity.
Ignored
Update - The math formula based tool calculated the future long/short zones prior London open(vertical blue line).
Note - a hand drawn discretionary box will normally have connected the last highs, lows and wicks which will generate a different box.
God not read so much nonsense from some people for a long time. Anyone care to share an actual trade explorer on a live account? With all this expert knowledge it's only reasonable to ask for solid proof..
God not read so much nonsense from some people for a long time. Anyone care to share an actual trade explorer on a live account? With all this expert knowledge it's only reasonable to ask for solid proof..
Ignored
They say trading is really hard, but it is a walk in the park compared to getting an account statement of 3 or 6 months.
Its very advanced stuff, you first have to open your trading platform, then you have to click on some buttons, then click on more buttons, then choose the period for the statement, then save the statement. As you can see it takes a lot of work and requires a lot of practice.
If you apply for a job at a big trading institution, its the first thing they will ask you. How good are you with account statements.
{quote} They say trading is really hard, but it is a walk in the park compared to getting an account statement of 3 or 6 months. Its very advanced stuff, you first have to open your trading platform, then you have to click on some buttons, then click on more buttons, then choose the period for the statement, then save the statement. As you can see it takes a lot of work and requires a lot of practice. If you apply for a job at a big trading institution, its the first thing they will ask you. How good are you with account statements....