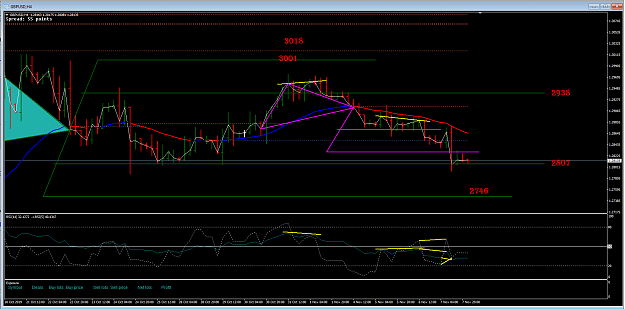
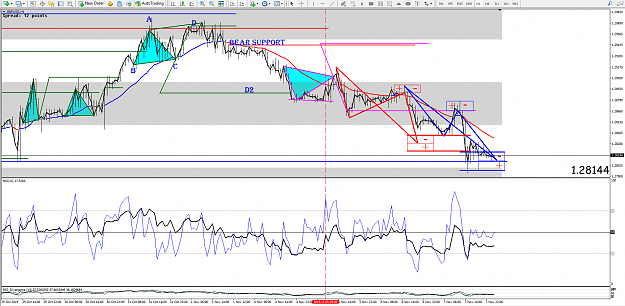
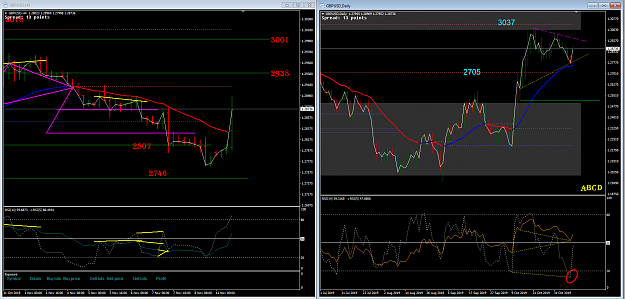
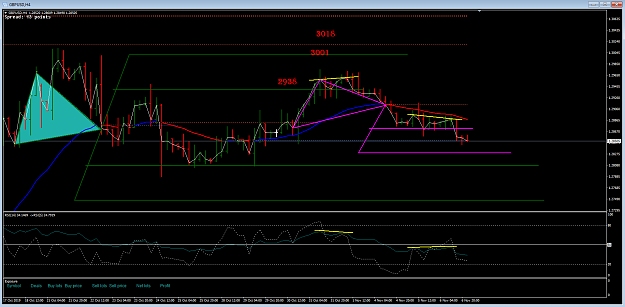
If we stay with the 4 hour and examine it a little further by zooming out we can see the blue triangle has not yet completed either side D targets.
If the average is indeed trying to make the lower low then we would envisage that price will make the lower D2.
These are very long term predictions and price could simply range between the two 50% for a considerable amount of time.
We need to be watchful of the Divs cropping up in time.
If the average is indeed trying to make the lower low then we would envisage that price will make the lower D2.
These are very long term predictions and price could simply range between the two 50% for a considerable amount of time.
We need to be watchful of the Divs cropping up in time.
Attached Image (click to enlarge)
1