The strategy of big players
Dear Subcribers,
the work of the big players is a big challenge every day for us as well as for the big players. As I've already said, it makes no sense for the big players just to push the price up, as they earn less. A concrete example can be found here:
Identification of the big players
Basically, it is important to understand the approach of the big players.
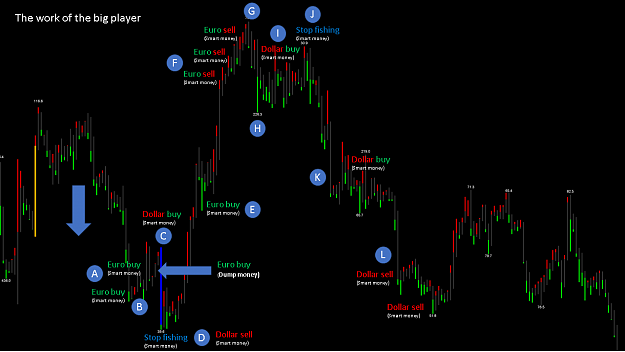
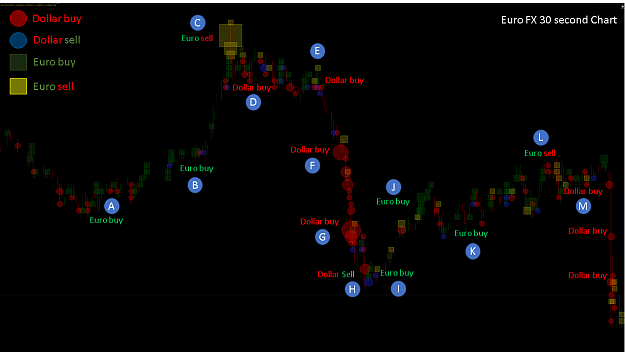
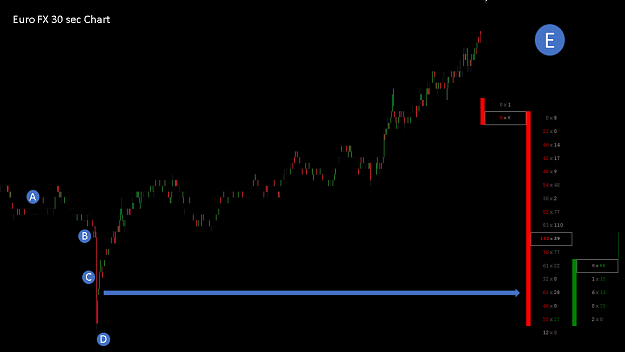
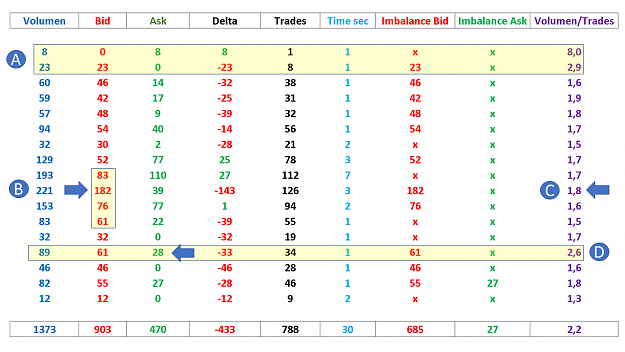
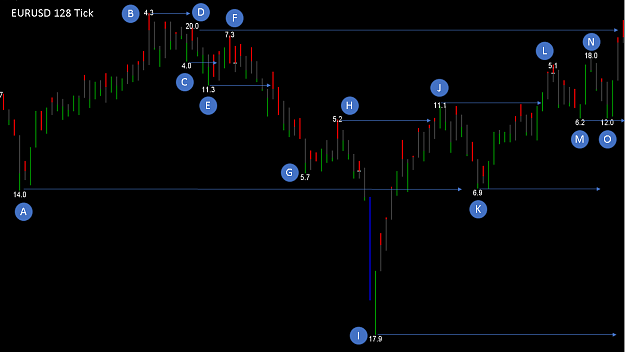
Here we see a chart in EURUSD H30. First, the price goes down, which means that a higher number of Bid will go into the market. To buy Ask, I need participants to sell the Bid. In this case, the big player starts to buy the first Ask already at point A. Starting at point B, the course is again higher. This arises partly because someone sells his dollars and partly because the big player buys the euro. Now many traders believe that the price continues to rise and start buying the euro. At point C, the big player buys a high number of dollars and pushes the price down sharply. Under point B are the stops of the traders. Once the stops are triggered, the downward trend accelerates. Professional big players are waiting at this point and are buying a large number of euros into this strong downtrend. At the same time the big player now sells his dollars, the price goes up again.
With the action of buying dollars and selling dollars right away, the big player does not make much money, but it stops many traders who think the price is now up. And that's how the big player secures its position upwards. Why does he do this?
If the big player at point C immediately pushes up the price, he would pull up many traders. In principle, that would not matter to the big player, but there is a problem. As the price moves higher, some retail traders start to step out to take their profits. For this they have to sell the euro and buy the dollar at the same time. This slows down the price trend. This would make the big player earn significantly less because he wants to push the price strongly up. So he has to make sure that these potential troublemakers are stopped out, before they can do any damage.
Now the price is going up to the point E. There, some traders get off to secure their profits. The big player is already waiting for it and buys in this downtrend again a high number of Ask. You can see that the price does not fall down sharply because someone absorbs this Bid under it. Then the course is pushed higher again. The game often runs on the same principle. The big player first pushes the price higher, many traders see a strong green candle and now enter. This is where the big player starts to get out of the euro. For this, initially little by little Bid is thrown in the market to sell the euro. Finally, the new buyers continue to believe that the price continues to go up. More retail traders enter the market and the big player gets its best out of its position. This happens exactly from point F. As a rule, I note the following, when the strong movement has gone up, I do not get in anymore. Because I do not want to be the one who helps the big players get out of their position cheaply. Because if the get off, a turnaround is likely.
The fac,t that the price is still up for a while is due to the retail traders, who believe that it is still going up. The big player sells its euro in small numbers so that the price does not fall too low. At point G many retail traders notice that there is no one who drives the price higher and a small panic sale begins, to get a good exit. At point H, a big player catches the course and pushes it up. Now the retail traders are getting back in and the big player is starting to buy the dollar sideways. A extreme stopfishing is omitted this time, because there were not many participants who would have expected falling course.
After that, the course was pushed to the point K and there was a re-distribution phase. Bid was collected there again and the course continued down. From point L, the big player has started to get out of the dollar. We recognize that the retail traders are basically used as cannon fodder to support the goals of big players. We have to keep in mind that the big banks sometimes make 60% of their total profits with the forex market. The forex market is for the big player a money printing machine. Anyone who believes that this described approach is always the same, is foolhardy. There are different market participants with different intentions. We also have to watch out for the high frequency traders, who are totally confused supply and demand. You can find some reports in this blog.
The tricks of high frequency traders
The hard unvarnished truth
Learning from high frequency dealers
Those who ignore these things will inevitably lose, lose and lose again. The whole strategies with market technology, indicators, trend trade, MACD, RSI are doomed in the long run, if one does not know, what happens in the market right now. If you know in more than 70% of the time whether the dollar is being bought or sold, or the euro is being bought or sold, you can take a look at the market and possibly guess what might happen next. Unfortunately, that does not work with the forex data because we just do not have enough information. Although the time and OHLC data are correct in the forex market, they lack the volume data (bid and ask) and the number of trades. Therefore you can not do without the stock market data. But also the pure stock market data are interesting only, if you use a Prop stock exchange software. This Prop software translates the stock exchange data for your requirements correctly. And now comes the biggest challenge. The setup and setting of the Prop Exchange Software. This takes the biggest time because the market never works equal.
There are many trainers who offer their strategies for volume trading. What they tell, is the biggest nonsense. The first time you see a footprint chart, the volume profile, or a DOM, you think this is the solution to all the problems. But you can not identify absorption with a footprint chart or the volume profile. At the beginning, the new stock market data is like a new indicator, one realizes that one eventually gets stuck and certainly can not find the holy grail. There is only one way to be profitable in the long term. You first have to know what's happening in the market right now.
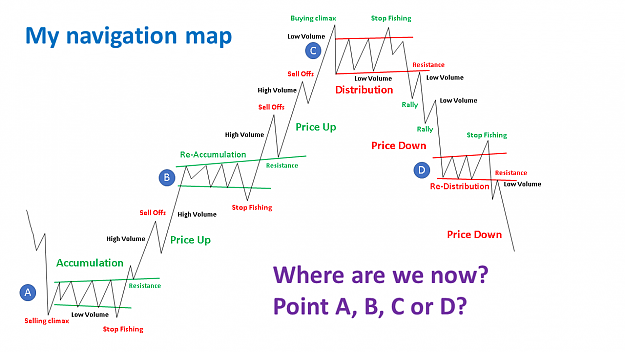
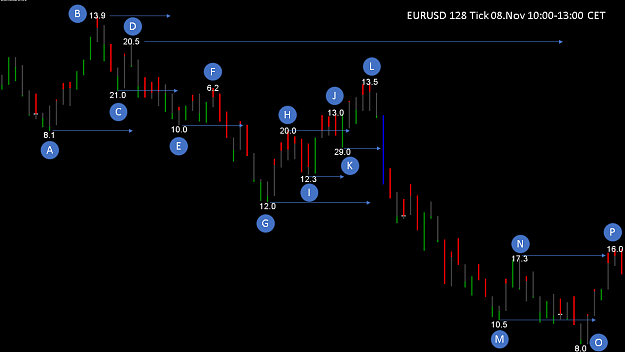
For that, the sideways phases are a decisive clue. I like trading in the sideways markets, which dominate the market 70% of the time. Of course I occasionally take a strong move up or down, but that's just a small side income I never count on. The sideways markets are very interesting. Suppose the course comes from above and there is a sideways market. Why is a sideways market forming?
Because the big players first get out of their positions or sub-positions and then absorb Bid or Ask. This means that in the first half of the sideways market positions are closed and in the second half Bid or Ask are bought. Therefore, the first half of the sideways market is a safe channel for me. Because the big players are slowly emerging from their positions while the retail traders believe that it goes up or down. The course is slower but you can trade very safe in a range. Once the absorption starts, you have to interpret it correctly if you want to take the strong move afterwards. As soon as a stronger absorption begins, the previous range is left, where you have to pay attention to an increasing volatility. I like doing downward movements as they run 30-40% faster and I have a lower risk. There is a detailed report on this:
Who is faster the euro or the dollar?
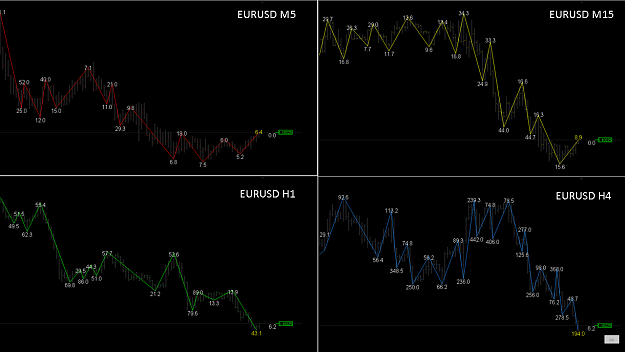
Let us now turn to the stock market data translated by a Prop software. Our project # 7 is about optimizing the settings in order to be able to detect possible absorption more quickly. This gives me the opportunity to determine the position on my navigation map.
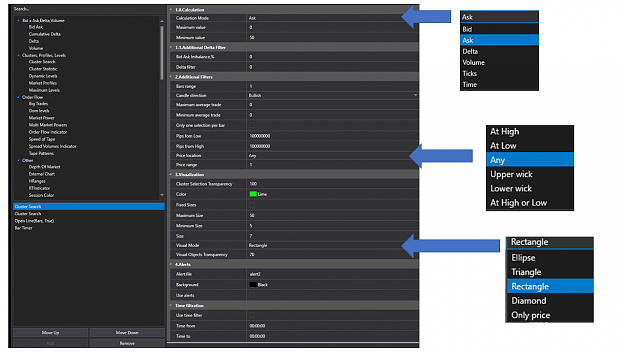
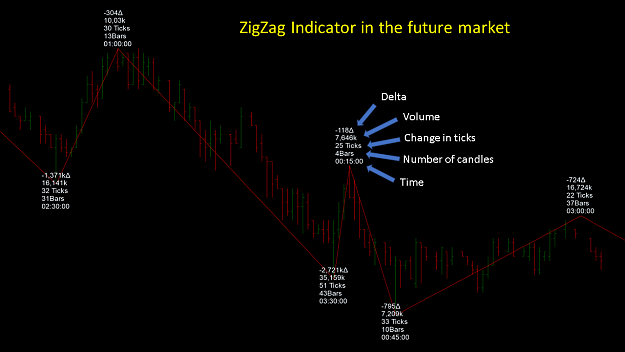
In my Prop software there are unlimited possibilities to analyze and highlight different clusters. I can decide if I want to analyze Bid, Ask, Delta, Volume, Ticks or Time. Min Value, max value, Bid Ask imbalance and Delta filter can be set. You can filter between bullish and bearish candles, the price range and the average number of trades. If I want to highlight a certain range within the candle, this is very variable possible. The presentation of the ad is very flexible. I do not write that to advertise this prop software, (because there are significantly cheaper software) I write this to you to describe the next experimental setup more precisely. For me, a software was decisive, with which I can identify very different clusters very flexible.

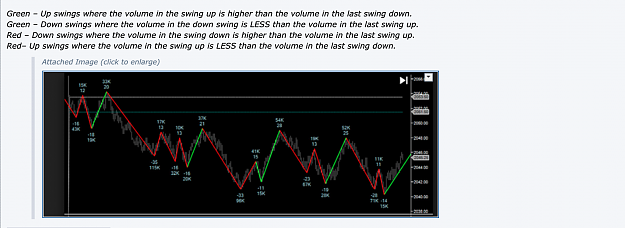
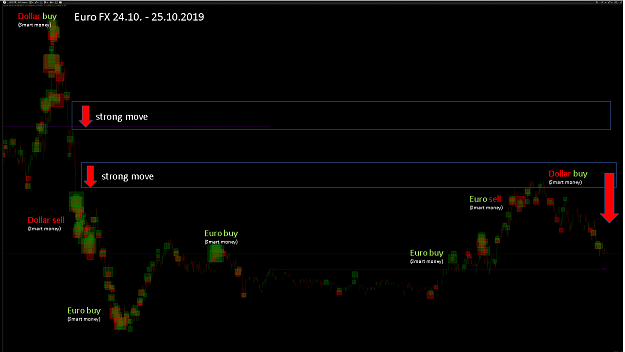
On the left side I have filtered the clusters that have at least 50 lot Ask and at least 50 Lot Bid in a bullish candle. This will enable me to detect within an uptrend when the euro may be bought and sold again. The ask in a bullish candle is often the push up, while the bid can often signal the selloff. I deliberately emphasize the word "can", because a bid can also be a dollar bought.
On the right side I have filtered the clusters which have at least 50 lot Ask and at least 50 Lot Bid in a bearish candle. This will enable me to recognize within a downtrend when the dollar may be bought and sold again. The Bid in a bearish candle is often the push down, while the Ask can often signal the sale of the dollar. Now it's time to label the navigation map, to see if my settings help me. After that it's about the optimization. This should serve as a simple example, but you still have to pay attention to many more things. I recommend working with a footprintchart, as it allows you to identify the number of lots in the Bid and Ask. This can simplify the cluster search.

From the previously identified map can now determine certain zones. It is well known that the big players run certain zones over and over until they stop working. Then new zones are searched. However, this depends on the extent to which retail traders are willing to buy Bid or Ask.

The zone marked here is also interesting, after that, the price has gone down by 100 ticks or 50 pip in forex. Interestingly, I would have drawn this zone in the forex market wrong, even with a tick chart.
With the stock market data, I was able to identify two strong moves that were a strong resistance area for me. Although I was not able to predict which of these two zones would push the price down, it became apparent that the dollar was being bought more heavily in the lower zone. That was the crucial point to decide on another short. Of course, there could have been a Stopfishing, then you would have been stopped, but would have had the chance for another entry.
This should only be a simple example of ways to better identify the market. However, you need more information, such as the time and sales list and the DOM. Basically, this does not always work, because the market in my view is random and therefore can not be grouped. Nevertheless, certain information helps to make assumptions that increase our probability of winning. Every trader has to create this setup individually, so you don t need any coaches. A few good books and a lot of time in front of the screen bring the necessary success, with time being the deciding factor.
Unfortunately, there is little information on, how the big player works. Good, if you know some high frequency traders or big players. But also their ways of trading change with time. With today's computer technology, self-learning algorithms and today's market conditions, one has to assume that every day it will be more difficult to survive in this market.
We know, not the big ones eat the little ones, but the fast ones the slow ones. That's why even smaller traders have a realistic chance in this market. And we should use this opportunity.
I wish you a successful trading week
best regards
Dear Subcribers,
the work of the big players is a big challenge every day for us as well as for the big players. As I've already said, it makes no sense for the big players just to push the price up, as they earn less. A concrete example can be found here:
Identification of the big players
Basically, it is important to understand the approach of the big players.
Attached Image (click to enlarge)
Here we see a chart in EURUSD H30. First, the price goes down, which means that a higher number of Bid will go into the market. To buy Ask, I need participants to sell the Bid. In this case, the big player starts to buy the first Ask already at point A. Starting at point B, the course is again higher. This arises partly because someone sells his dollars and partly because the big player buys the euro. Now many traders believe that the price continues to rise and start buying the euro. At point C, the big player buys a high number of dollars and pushes the price down sharply. Under point B are the stops of the traders. Once the stops are triggered, the downward trend accelerates. Professional big players are waiting at this point and are buying a large number of euros into this strong downtrend. At the same time the big player now sells his dollars, the price goes up again.
With the action of buying dollars and selling dollars right away, the big player does not make much money, but it stops many traders who think the price is now up. And that's how the big player secures its position upwards. Why does he do this?
If the big player at point C immediately pushes up the price, he would pull up many traders. In principle, that would not matter to the big player, but there is a problem. As the price moves higher, some retail traders start to step out to take their profits. For this they have to sell the euro and buy the dollar at the same time. This slows down the price trend. This would make the big player earn significantly less because he wants to push the price strongly up. So he has to make sure that these potential troublemakers are stopped out, before they can do any damage.
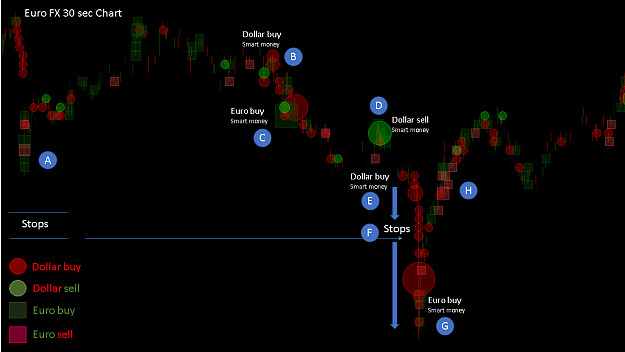
Now the price is going up to the point E. There, some traders get off to secure their profits. The big player is already waiting for it and buys in this downtrend again a high number of Ask. You can see that the price does not fall down sharply because someone absorbs this Bid under it. Then the course is pushed higher again. The game often runs on the same principle. The big player first pushes the price higher, many traders see a strong green candle and now enter. This is where the big player starts to get out of the euro. For this, initially little by little Bid is thrown in the market to sell the euro. Finally, the new buyers continue to believe that the price continues to go up. More retail traders enter the market and the big player gets its best out of its position. This happens exactly from point F. As a rule, I note the following, when the strong movement has gone up, I do not get in anymore. Because I do not want to be the one who helps the big players get out of their position cheaply. Because if the get off, a turnaround is likely.
The fac,t that the price is still up for a while is due to the retail traders, who believe that it is still going up. The big player sells its euro in small numbers so that the price does not fall too low. At point G many retail traders notice that there is no one who drives the price higher and a small panic sale begins, to get a good exit. At point H, a big player catches the course and pushes it up. Now the retail traders are getting back in and the big player is starting to buy the dollar sideways. A extreme stopfishing is omitted this time, because there were not many participants who would have expected falling course.
After that, the course was pushed to the point K and there was a re-distribution phase. Bid was collected there again and the course continued down. From point L, the big player has started to get out of the dollar. We recognize that the retail traders are basically used as cannon fodder to support the goals of big players. We have to keep in mind that the big banks sometimes make 60% of their total profits with the forex market. The forex market is for the big player a money printing machine. Anyone who believes that this described approach is always the same, is foolhardy. There are different market participants with different intentions. We also have to watch out for the high frequency traders, who are totally confused supply and demand. You can find some reports in this blog.
The tricks of high frequency traders
The hard unvarnished truth
Learning from high frequency dealers
Those who ignore these things will inevitably lose, lose and lose again. The whole strategies with market technology, indicators, trend trade, MACD, RSI are doomed in the long run, if one does not know, what happens in the market right now. If you know in more than 70% of the time whether the dollar is being bought or sold, or the euro is being bought or sold, you can take a look at the market and possibly guess what might happen next. Unfortunately, that does not work with the forex data because we just do not have enough information. Although the time and OHLC data are correct in the forex market, they lack the volume data (bid and ask) and the number of trades. Therefore you can not do without the stock market data. But also the pure stock market data are interesting only, if you use a Prop stock exchange software. This Prop software translates the stock exchange data for your requirements correctly. And now comes the biggest challenge. The setup and setting of the Prop Exchange Software. This takes the biggest time because the market never works equal.
There are many trainers who offer their strategies for volume trading. What they tell, is the biggest nonsense. The first time you see a footprint chart, the volume profile, or a DOM, you think this is the solution to all the problems. But you can not identify absorption with a footprint chart or the volume profile. At the beginning, the new stock market data is like a new indicator, one realizes that one eventually gets stuck and certainly can not find the holy grail. There is only one way to be profitable in the long term. You first have to know what's happening in the market right now.
Attached Image (click to enlarge)
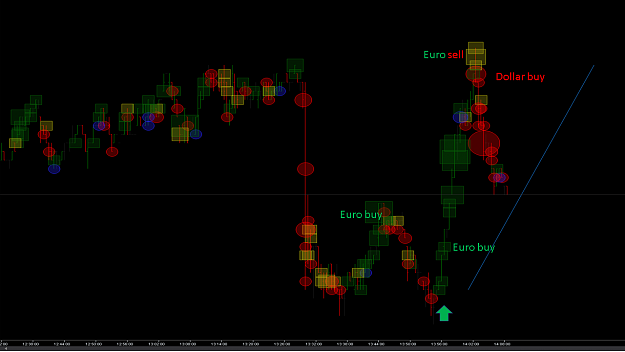
For that, the sideways phases are a decisive clue. I like trading in the sideways markets, which dominate the market 70% of the time. Of course I occasionally take a strong move up or down, but that's just a small side income I never count on. The sideways markets are very interesting. Suppose the course comes from above and there is a sideways market. Why is a sideways market forming?
Because the big players first get out of their positions or sub-positions and then absorb Bid or Ask. This means that in the first half of the sideways market positions are closed and in the second half Bid or Ask are bought. Therefore, the first half of the sideways market is a safe channel for me. Because the big players are slowly emerging from their positions while the retail traders believe that it goes up or down. The course is slower but you can trade very safe in a range. Once the absorption starts, you have to interpret it correctly if you want to take the strong move afterwards. As soon as a stronger absorption begins, the previous range is left, where you have to pay attention to an increasing volatility. I like doing downward movements as they run 30-40% faster and I have a lower risk. There is a detailed report on this:
Who is faster the euro or the dollar?
Let us now turn to the stock market data translated by a Prop software. Our project # 7 is about optimizing the settings in order to be able to detect possible absorption more quickly. This gives me the opportunity to determine the position on my navigation map.
Attached Image (click to enlarge)
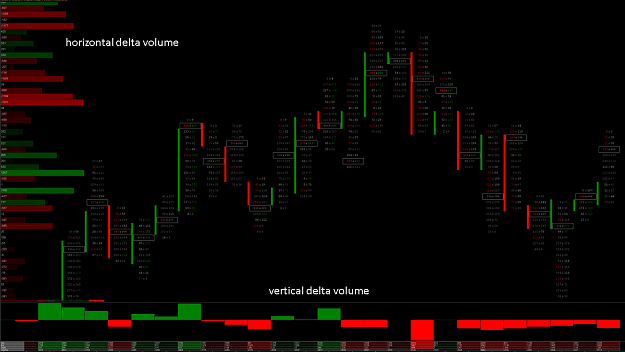
In my Prop software there are unlimited possibilities to analyze and highlight different clusters. I can decide if I want to analyze Bid, Ask, Delta, Volume, Ticks or Time. Min Value, max value, Bid Ask imbalance and Delta filter can be set. You can filter between bullish and bearish candles, the price range and the average number of trades. If I want to highlight a certain range within the candle, this is very variable possible. The presentation of the ad is very flexible. I do not write that to advertise this prop software, (because there are significantly cheaper software) I write this to you to describe the next experimental setup more precisely. For me, a software was decisive, with which I can identify very different clusters very flexible.
Attached Image (click to enlarge)
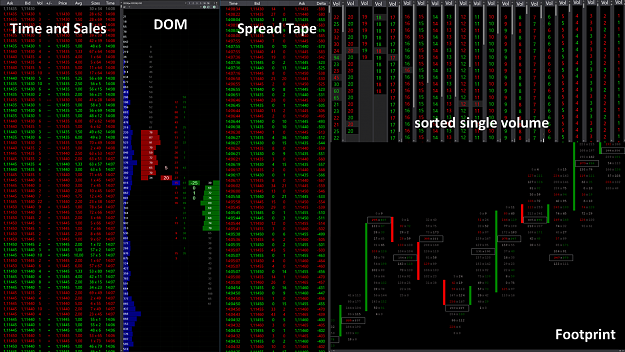
On the left side I have filtered the clusters that have at least 50 lot Ask and at least 50 Lot Bid in a bullish candle. This will enable me to detect within an uptrend when the euro may be bought and sold again. The ask in a bullish candle is often the push up, while the bid can often signal the selloff. I deliberately emphasize the word "can", because a bid can also be a dollar bought.
On the right side I have filtered the clusters which have at least 50 lot Ask and at least 50 Lot Bid in a bearish candle. This will enable me to recognize within a downtrend when the dollar may be bought and sold again. The Bid in a bearish candle is often the push down, while the Ask can often signal the sale of the dollar. Now it's time to label the navigation map, to see if my settings help me. After that it's about the optimization. This should serve as a simple example, but you still have to pay attention to many more things. I recommend working with a footprintchart, as it allows you to identify the number of lots in the Bid and Ask. This can simplify the cluster search.
Attached Image (click to enlarge)
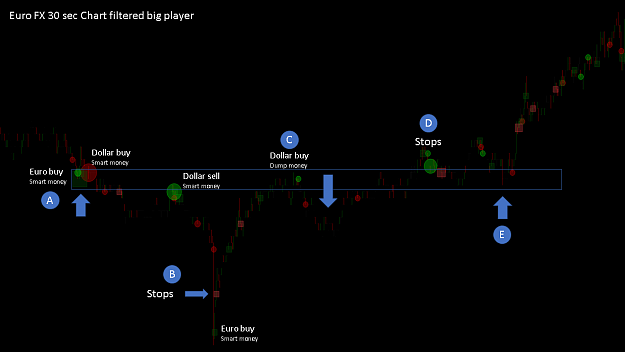
From the previously identified map can now determine certain zones. It is well known that the big players run certain zones over and over until they stop working. Then new zones are searched. However, this depends on the extent to which retail traders are willing to buy Bid or Ask.
Attached Image (click to enlarge)
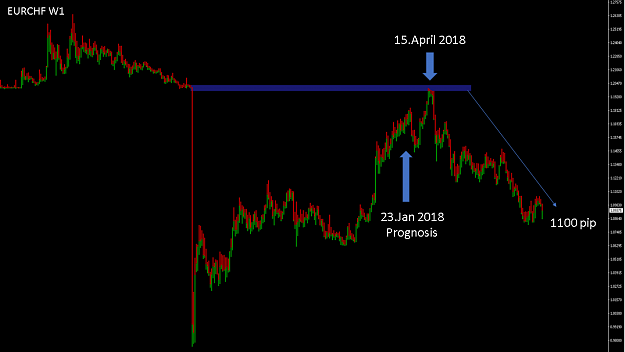
The zone marked here is also interesting, after that, the price has gone down by 100 ticks or 50 pip in forex. Interestingly, I would have drawn this zone in the forex market wrong, even with a tick chart.
Attached Image (click to enlarge)
With the stock market data, I was able to identify two strong moves that were a strong resistance area for me. Although I was not able to predict which of these two zones would push the price down, it became apparent that the dollar was being bought more heavily in the lower zone. That was the crucial point to decide on another short. Of course, there could have been a Stopfishing, then you would have been stopped, but would have had the chance for another entry.
This should only be a simple example of ways to better identify the market. However, you need more information, such as the time and sales list and the DOM. Basically, this does not always work, because the market in my view is random and therefore can not be grouped. Nevertheless, certain information helps to make assumptions that increase our probability of winning. Every trader has to create this setup individually, so you don t need any coaches. A few good books and a lot of time in front of the screen bring the necessary success, with time being the deciding factor.
Unfortunately, there is little information on, how the big player works. Good, if you know some high frequency traders or big players. But also their ways of trading change with time. With today's computer technology, self-learning algorithms and today's market conditions, one has to assume that every day it will be more difficult to survive in this market.
We know, not the big ones eat the little ones, but the fast ones the slow ones. That's why even smaller traders have a realistic chance in this market. And we should use this opportunity.
I wish you a successful trading week
best regards
Forget:That does not work, amateurs build the ark, pros the Titanic!
1