Hi dbrown101
Maybe these from our friend fti’s posts may help…
FTI posts.
1.
For dealers, its a different game, because when markets are going up in a BEAR market, customers keep making them short,
their book keeps getting bigger short, but their average cost of being short keeps going up.
all they have to do is to wait for the trend to enforce and
when the market returns to the point where the buying started ,
he would make nearly the amount of money that made him short in the first place.
For this to happen, he has to have a book big enough to accommadate the customer base.
AND as the market swings back towards the start point, he has to ascertain that his book of shorts, be kept constant.
This is because on the way down the customers will be making him long.
So by constantly covering back to back on the way down he maintains his book short.
So for the dealer, as long as he maintains his poise in the direction of the markets major trend,
he will always make "scalp money", guanranteed.
His modus operandi, is to "duck and move quickly"
so as to have a better average on the up swing towards stops to maximise his shorting near the top of the swing.
This scenerio is most effective if there are stop near levels where he las a large order to sell,
where he can help the customer sell OB and "kill the sitting duck stops" in the same blow.
Another senerio is where by the heavy selling is CB levels or specific sell zones,
where many teir 1 are ready to pounch on the buyers.
You must understand that only tier 1 and some big tier 2 will have this advantage.
This is the reason, why you have rubber band snap backs in the direction of trend directions,
and slow puffy moves counter trend.
Am I making any sense to anyone here?
So we use daily trend as the direction to build book size and short charts to make market for retraces.
Do discuss this on this trread, no questions are silly, just discuss until it becomes clear.
Don't understand !, argue until you understand.
Fight if you must, I will not complain.
YOU MUST GET THE CONCEPT OF MARKET STRUCTURE RIGHT TO UNDERSTAND THE CHARTS.
2.
So you would use the daily charts for trend and candle formations to indicate possible changes in movement. Do you use the hourly similarly? ..."
Yes I use Daily Chart studies to indicate trend,
I use short charts to indicate form.
Ponder this,
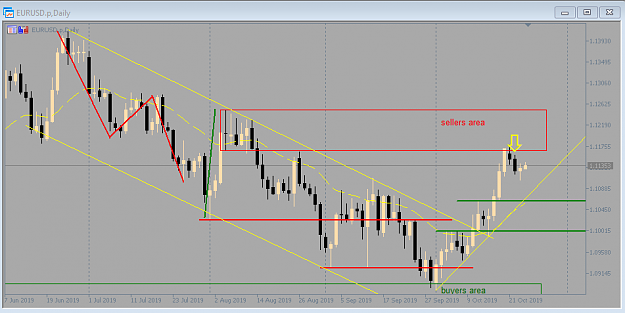
On the daily EUR/USD now we see possible topping formation, correct.
We may be right, So tell me where is it going?Should be Down, right?
When will we know if it is going down?
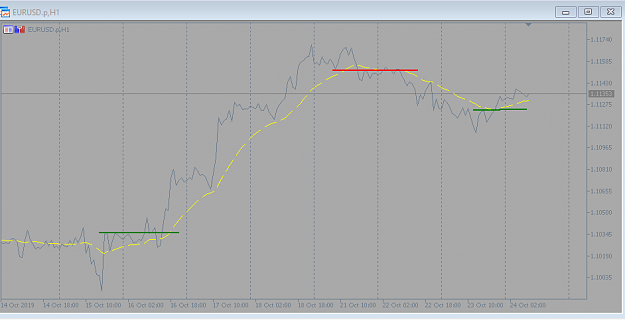
What if on the short charts, its going up?
So do we still want to go short?
So when should we go short?
When the short chart shows you that it topping out, right?
Me back now…
So to me t/a and p/a taken from the core masters is the foundation of what we need to use but we must know WHY the moves are happening this bring in the above from fti and the basics of fundy’s, what Eddy and Franco have shown is good to help you along the learning curve, it is just a shame the way things turned out, I believe they are both good people but life throws things at us and we all face the consequences in the end.
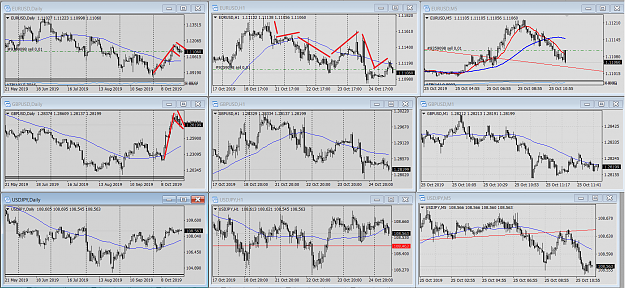
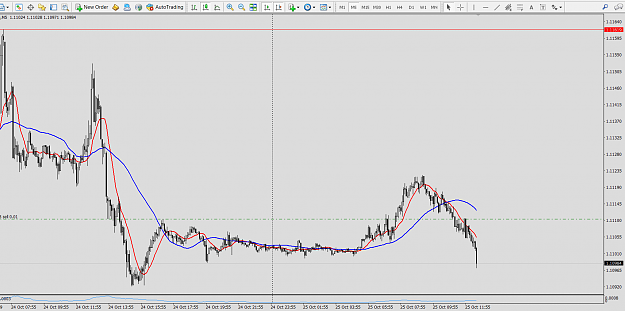
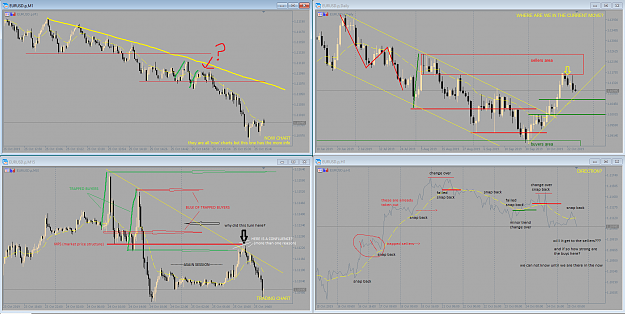
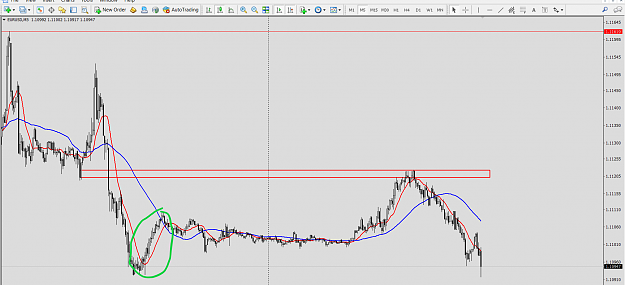
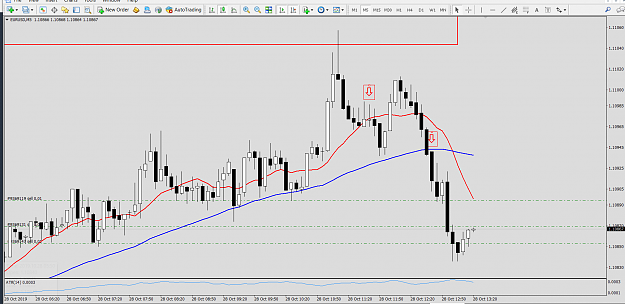
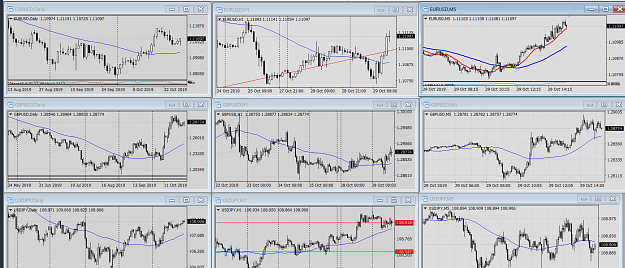
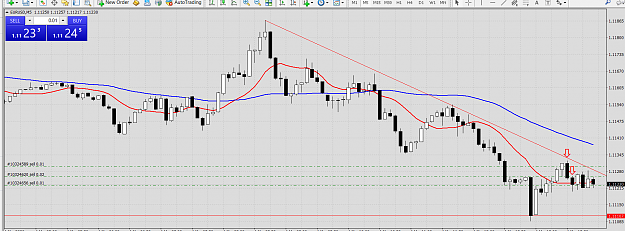
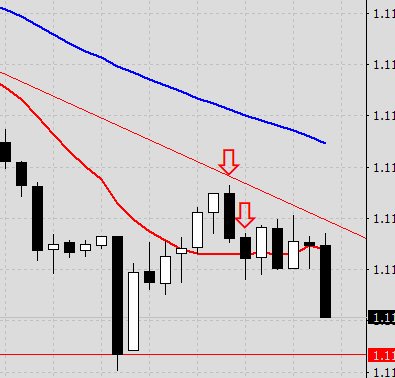
Here are today’ charts of the E/U, you can see what fti is saying within them about the moves and why/how they happen, I have changed the hourly to a line chart as this shows certain things that fti is talking about better, you will in the end find your own way of trading in the now, what you see in other’s journal’s and what is written where ever you look you can take parts that may help you but in the end you need to find your way of trading that suits you, I believe so long as you can use the core basics set out in fti’s training manual you will be on the correct path to succeed.
Regards
Phil.
Maybe these from our friend fti’s posts may help…
FTI posts.
1.
For dealers, its a different game, because when markets are going up in a BEAR market, customers keep making them short,
their book keeps getting bigger short, but their average cost of being short keeps going up.
all they have to do is to wait for the trend to enforce and
when the market returns to the point where the buying started ,
he would make nearly the amount of money that made him short in the first place.
For this to happen, he has to have a book big enough to accommadate the customer base.
AND as the market swings back towards the start point, he has to ascertain that his book of shorts, be kept constant.
This is because on the way down the customers will be making him long.
So by constantly covering back to back on the way down he maintains his book short.
So for the dealer, as long as he maintains his poise in the direction of the markets major trend,
he will always make "scalp money", guanranteed.
His modus operandi, is to "duck and move quickly"
so as to have a better average on the up swing towards stops to maximise his shorting near the top of the swing.
This scenerio is most effective if there are stop near levels where he las a large order to sell,
where he can help the customer sell OB and "kill the sitting duck stops" in the same blow.
Another senerio is where by the heavy selling is CB levels or specific sell zones,
where many teir 1 are ready to pounch on the buyers.
You must understand that only tier 1 and some big tier 2 will have this advantage.
This is the reason, why you have rubber band snap backs in the direction of trend directions,
and slow puffy moves counter trend.
Am I making any sense to anyone here?
So we use daily trend as the direction to build book size and short charts to make market for retraces.
Do discuss this on this trread, no questions are silly, just discuss until it becomes clear.
Don't understand !, argue until you understand.
Fight if you must, I will not complain.
YOU MUST GET THE CONCEPT OF MARKET STRUCTURE RIGHT TO UNDERSTAND THE CHARTS.
2.
So you would use the daily charts for trend and candle formations to indicate possible changes in movement. Do you use the hourly similarly? ..."
Yes I use Daily Chart studies to indicate trend,
I use short charts to indicate form.
Ponder this,
On the daily EUR/USD now we see possible topping formation, correct.
We may be right, So tell me where is it going?Should be Down, right?
When will we know if it is going down?
What if on the short charts, its going up?
So do we still want to go short?
So when should we go short?
When the short chart shows you that it topping out, right?
Me back now…
So to me t/a and p/a taken from the core masters is the foundation of what we need to use but we must know WHY the moves are happening this bring in the above from fti and the basics of fundy’s, what Eddy and Franco have shown is good to help you along the learning curve, it is just a shame the way things turned out, I believe they are both good people but life throws things at us and we all face the consequences in the end.
Here are today’ charts of the E/U, you can see what fti is saying within them about the moves and why/how they happen, I have changed the hourly to a line chart as this shows certain things that fti is talking about better, you will in the end find your own way of trading in the now, what you see in other’s journal’s and what is written where ever you look you can take parts that may help you but in the end you need to find your way of trading that suits you, I believe so long as you can use the core basics set out in fti’s training manual you will be on the correct path to succeed.
Regards
Phil.
Attached Image (click to enlarge)
Attached Image (click to enlarge)
-be careful about what you allow to be put in your mind-
3