Hi gruys, I am a trader in progress and was hoping that you could please evaluate my work with advice and feedback on how could become a better trader using supply and demand
Hi Guys, It feels like I'm back in primary school. I've watched many of AKT's videos on Storehouse Analytics and I have learnt a lot, but I'm very new to S.A.D. Just to be certain that I start the drawing of the zones correctly, can someone please share with me how to properly draw the following conditions: Drop, Base, Rally. Rally, Base, Rally. Rally, Base, Drop. Drop, Base, Drop. I don't know when to include the bodies and wicks in Supply and Demand Zones. Apologies for this guys, but like I said, I am very new to this concept. Thank you so much!...
Ignored
Hi Daubert.
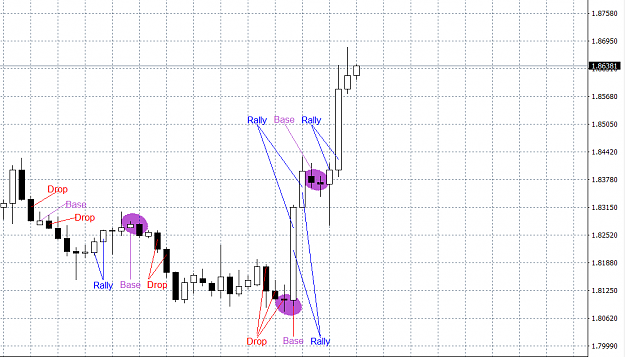
I'm inserting a snapshot of GBPAUD H4 regarding your enquire.
Attached Image (click to enlarge)
I hope it will be clearer for you in the future these DBR,RBR,RBD,DBD.
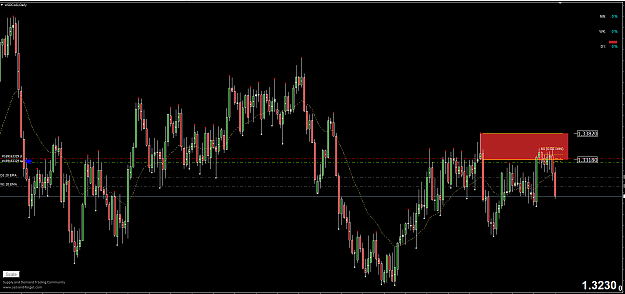
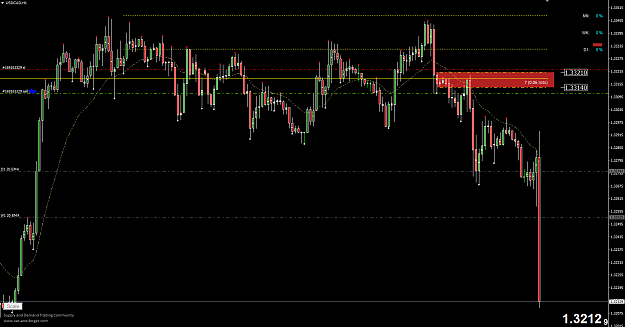
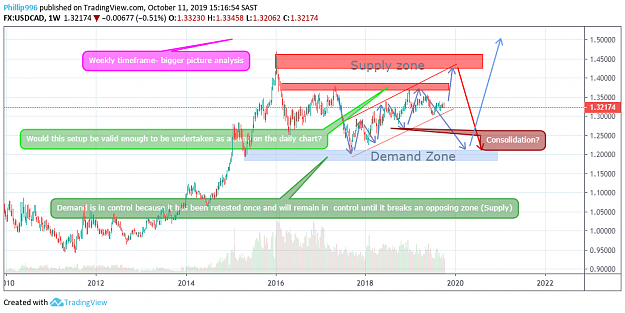
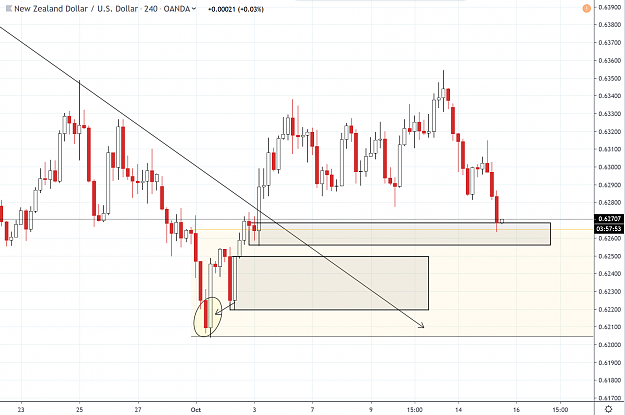
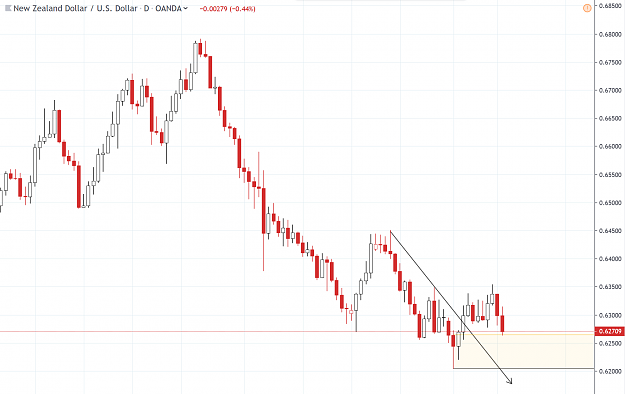
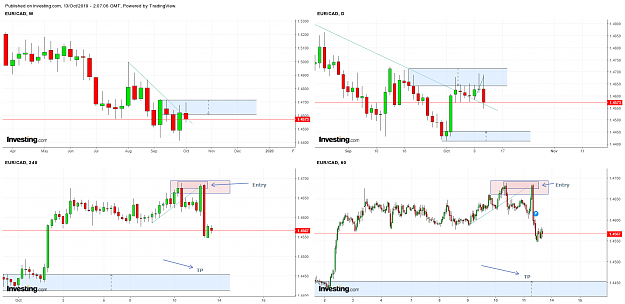
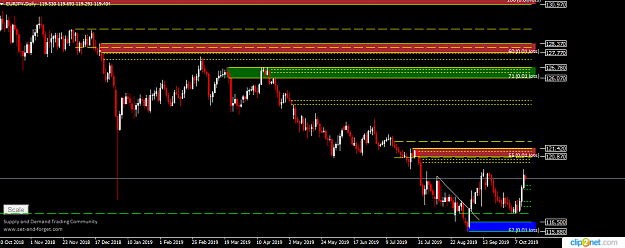
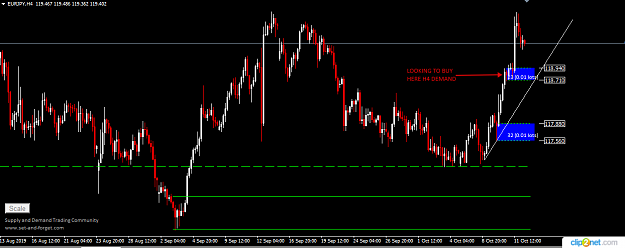
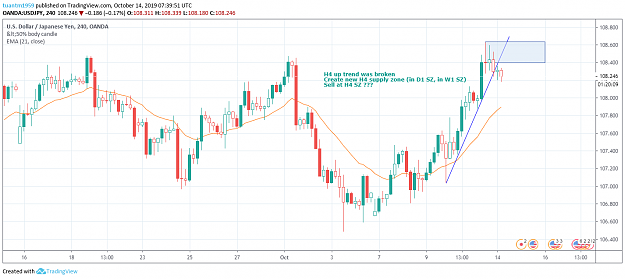
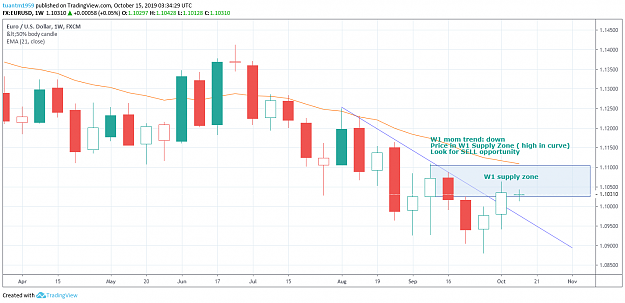
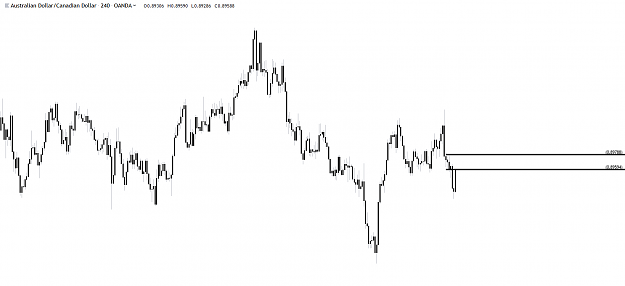
USDCAD short smashed from the daily supply area.... {image} {image}
Ignored
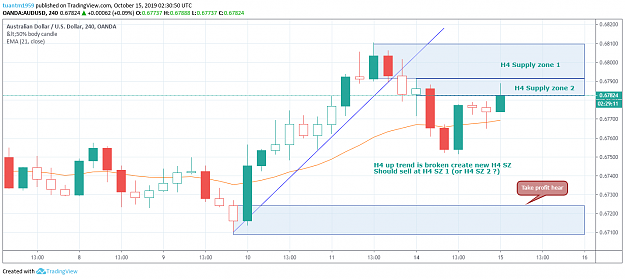
That's a great looking trade Bleeze. I didn't take it because I was looking to enter on 4H timeframe and price didn't reach my order unfortunately. But it is looking good after CAD news. I actually entered a few days earlier, but got stopped out on BE because I moved SL after price was in my favor... unlucky..
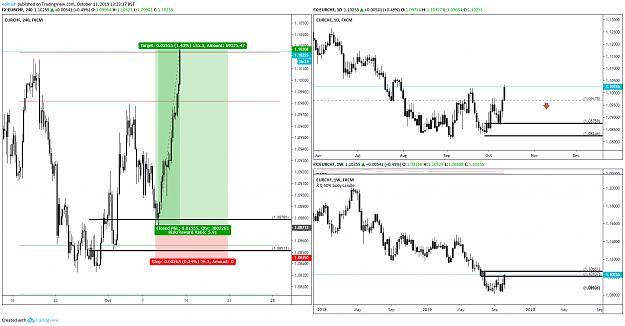
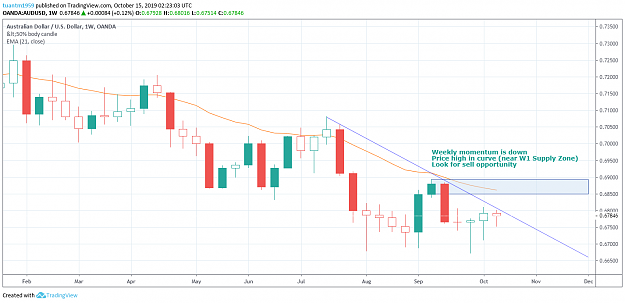
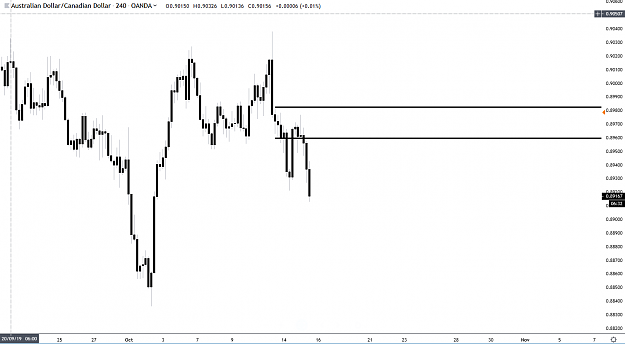
But I did take EURCAD. Daily trend is kinda sideways but it is in tune with Weekly downtrend and supply area.
{quote} Hi Daubert. I'm inserting a snapshot of GBPAUD H4 regarding your enquire. {image} I hope it will be clearer for you in the future these DBR,RBR,RBD,DBD.
Ignored
Hi frwrd,
Thank you so much for the illustration. This is now perfectly clear. I really appreciate your efforts.
I guess the next thing I want to ask is how to draw them properly. How do I properly draw Supply and Demand zones? Do I include the tails and wicks as well as the body of the candle? Do I only draw the base or the drop and rallies as well?
{quote} Hi frwrd, Thank you so much for the illustration. This is now perfectly clear. I really appreciate your efforts. I guess the next thing I want to ask is how to draw them properly. How do I properly draw Supply and Demand zones? Do I include the tails and wicks as well as the body of the candle? Do I only draw the base or the drop and rallies as well? Thank you once again.
Ignored
Hi Daubert,
EDITED answer.
You actually made me think.
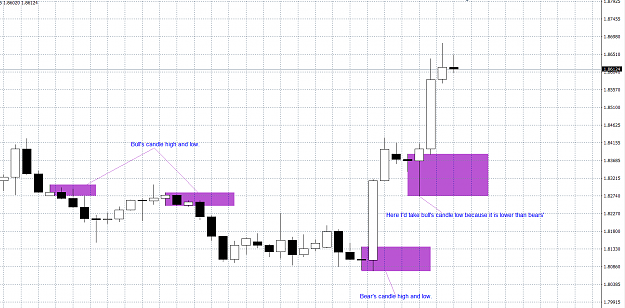
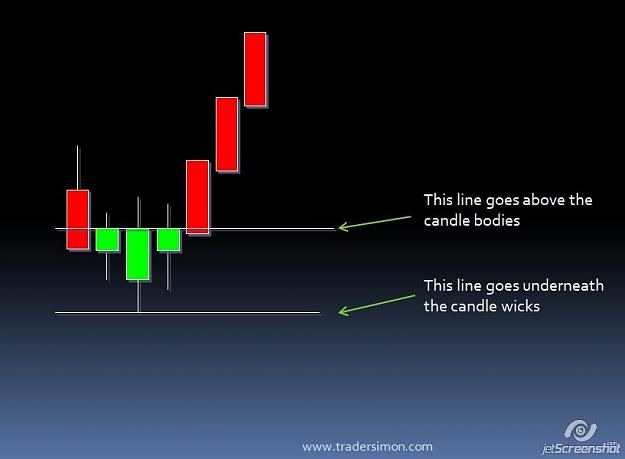
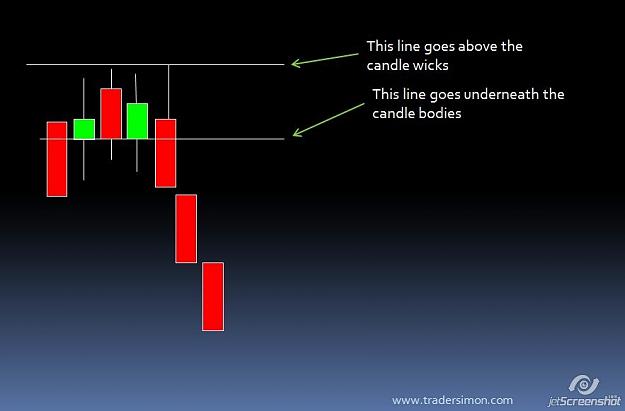
I'd draw Supply and Demand zones using mentioned bases. IMHO wicks should be used to draw them correctly. Have a look at next snapshot.
Attached Image (click to enlarge)
I'll be happy if the owner of the thread comment it.
He's the master.
{quote} Hi Daubert, EDITED answer. You actually made me think. I'd draw Supply and Demand zones using mentioned bases. IMHO wicks should be used to draw them correctly. Have a look at next snapshot. {image} I'll be happy if the owner of the thread comment it. He's the master.
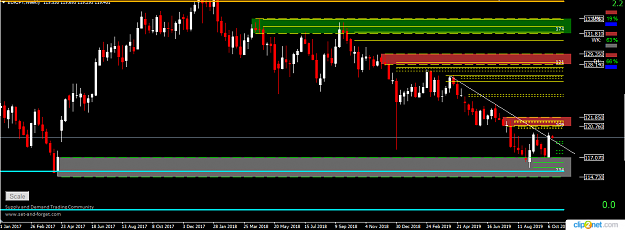
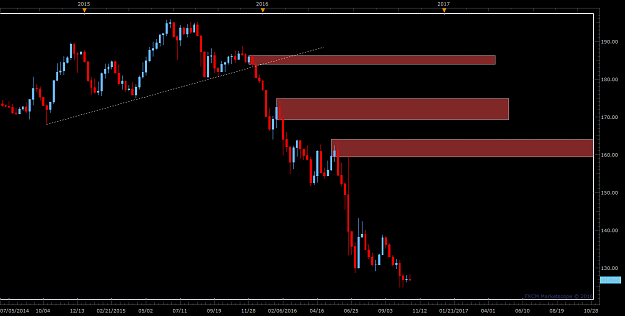
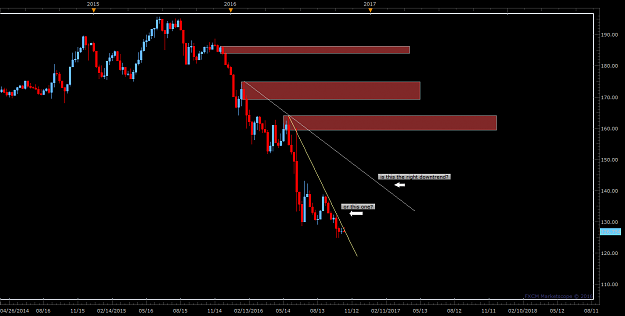
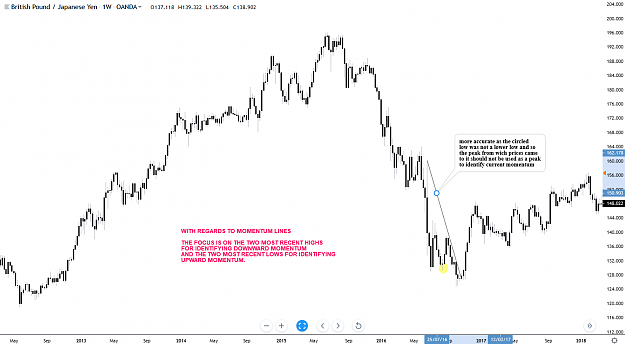
Hey guys, I have a problem to find the right peaks to draw the downtrend here, this is a weekly chart of GBPJPY (2016). I'm so confused. please help! {image} {image}
Ignored
Hello Royal146.
Welcome to T.I.O.F
Good to have you.
If i may, the lines on your chart are drawn using the rules guiding traditional technical analysis and can be quite useful to know as a lot of traders around the world will often use these lines as triggers for some form of action.
For momentum within the methodology though, the focus is more with recent highs and lows, the last two in particular
please see the picture below. Hope it helps
best wishes
Attached Image (click to enlarge)
Be careful what you think because your thoughts run your life..Solomon