Who is faster the euro or the dollar?
Hello Subsciber,
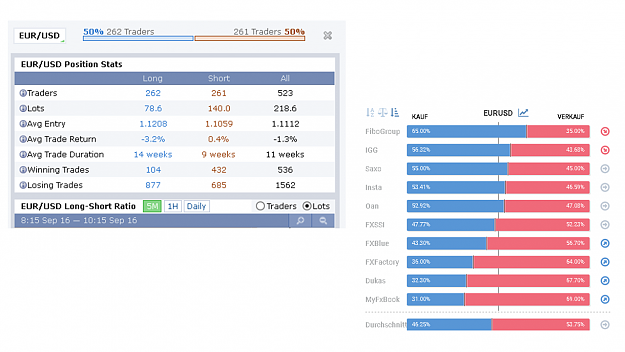
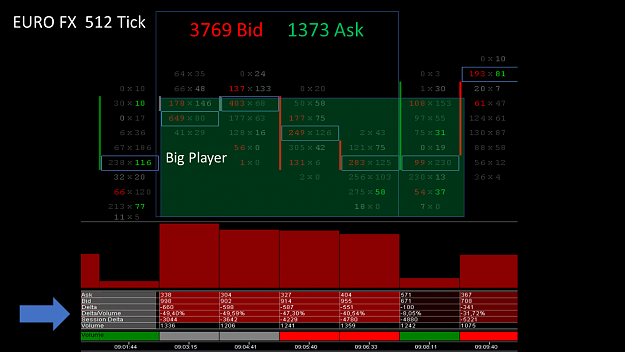
As we have already stated, the price movements in the forex market are due to pure coincidence. Markets are rarely determined by news, but usually by the strategies of big players. No one is able to predict the course of the price and to determine exactly. In a randomly generated market, you have a realistic chance of making the odds in your favor. But that's exactly what you need the right information for.
Why stock market prices are rising more slowly than falling
It seems like bewitched Stock prices seem to be rising in slow motion over a longer period of time sometimes and suddenly there is a very rapid and strong downward movement. This movement seems to be stronger and more intense than the previous price increase. Within a much shorter time, a spread is sold off, which previously took a much longer time to rise. To get up in the stock market everybody have to take the stairs and after go down with a fast lift. This behavior is not untypical in the stock market and there are good reasons why these patterns occur again and again.
Most investors going Long in equity markets and expect rising prices. These positions are hedged with stops. If these stops are at obvious technical course levels and a short-term downtrend reaches this stop, it may trigger another downswing.
It is no longer a secret that bad news spreads faster than good news. There is a risk that bad news will be priced in faster than good news.
With rising prices in the stock market, more and more money is needed to actually acquire the position, because the share is always more expensive. The application of these funds often requires a certain time. Selling is relatively easy, because no money is needed, but the money is posted back to the safe deposit.
Confidence always arises very slowly, but disappears very quickly. To invest money requires a share to trust. Investors who have put their money into funds, usually withdraw it only in the loss phase, since they no longer trust the fund. This forces fund managers to sell positions at unfavorable times to pay off investors. As a result, there may be further selling pressure in the market, driving prices further down.
This behavior is typical for the stock markets and occurs again and again in certain market situations. Now I have asked myself the question, how this is in the forex currency market. When I buy the euro in the foreign exchange market, I sell the dollar at the same time, and when I buy the dollar, I also sell the euro. So, when I buy the euro, I expect prices to rise, and when I buy the dollar, I expect falling prices. I now wanted to find out whether there is a similar pattern of behavior in the EURUSD in order to gain insights.
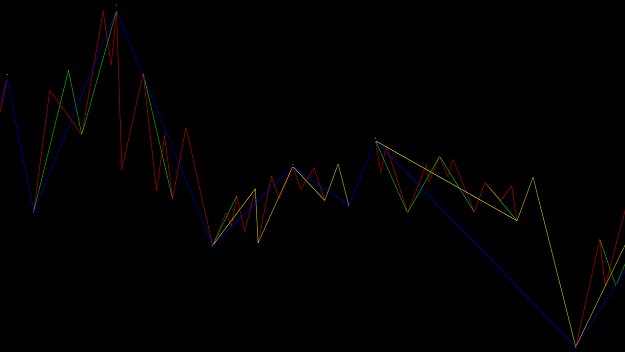
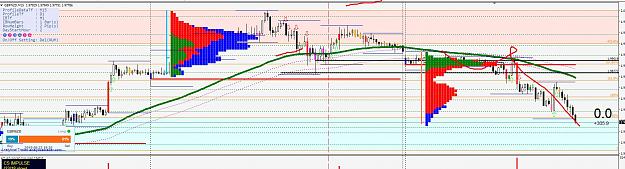
In order to be able to make a representative statement, I have examined a monthly chart of the EURUSD since 1971. A zigzag indicator with the setting 8/4/2 are used here. The numbers you see above or below the peaks indicate the average pipettes of a candle within each time period. In the last 558 months, there have been 17 uptrend and 17 downtrend. Let's take a closer look at these trends.
Under point A you can see the 17 different uptrends, under point B the 17 different downtrends within the last 558 months. The first uptrend in 1971 went over seven months and the candles had an average size of 3520 pipettes or 352 pip. Since the indicator represents the average number of pipettes I would like to use this in the following examples. Within 558 months, there were 329 months of average upward trends with a total of 510,869 pips. The downtrend was over 229 months with a total of 457,158 pips. The difference of more than 50,000 pips corresponds to the difference between the currently current price and the starting price from 1971. Already here we can already guess that the downward movements took place much faster than the upward movements.
On average, an upward candle had 2077 pip for 19 months, while a down candle had an average size of 2879 pip for 13 months. This gives a result of 39%. This means that the bearish candle has gone down 39% faster on average than a bullish candle has gone up.
The uptrend lasted an average of 19 months while the downtrend lasted 13 months on average. Normally, within this equation, one would have to look at what the bearish candle would have achieved within 19 months in order to derive a concrete derivation, but I have renounced that for reasons of efficiency.
Under point B, I divided the total number of pips by the number of months. In the bullish movements we come to an average of 1550 pip and in the bearish movements we come to 2000 PiP, which on average has reached the respective candle. This is a result of 29% in favor of the bearish candle.
Conclusion:
Personally, with this comparison I can see that the downward movements are between 30 and 40% faster than the upward movements. This is an important insight because I believe that the longer you are with your position in the market, the greater the risk of being stopped out by an unexpected strong move.
If I put in this case only a downtrend within the EURUSD, I could reduce my time in the market by 30-40%. Provided that the price movement would continue to behave in the same way in the future.
Surely everyone can still remember the Franken Schock in 2015, where the price went down in seconds by 22,000 pipettes. For those of the traders who only bet on a downtrend, this breakdown would not have been a problem. The curious thing is that there has never been such an upward movement.
For me personally, this question of security does not arise, since even as a professional forex trader, I can never lose more than my deposit within my brokerage account. But as a scalper, I have to ask myself which strategy I can best manage, within the shortest possible time, to negotiate my lowest risk trading. And the likelihood of reaching my goal faster is 40% higher in a downtrend than in an uptrend. Of course, this is not a reason for me to focus solely on downtrends, but it is an important insight, which advances me in my money management
Next week, I will put together the odds and assumptions, to make an interesting strategy to increase the overall probability of winning. This enables each of you to optimize your individual likelihood.
I wish you a nice weekend and a successful trading week
best regards
Hello Subsciber,
As we have already stated, the price movements in the forex market are due to pure coincidence. Markets are rarely determined by news, but usually by the strategies of big players. No one is able to predict the course of the price and to determine exactly. In a randomly generated market, you have a realistic chance of making the odds in your favor. But that's exactly what you need the right information for.
Why stock market prices are rising more slowly than falling
It seems like bewitched Stock prices seem to be rising in slow motion over a longer period of time sometimes and suddenly there is a very rapid and strong downward movement. This movement seems to be stronger and more intense than the previous price increase. Within a much shorter time, a spread is sold off, which previously took a much longer time to rise. To get up in the stock market everybody have to take the stairs and after go down with a fast lift. This behavior is not untypical in the stock market and there are good reasons why these patterns occur again and again.
Most investors going Long in equity markets and expect rising prices. These positions are hedged with stops. If these stops are at obvious technical course levels and a short-term downtrend reaches this stop, it may trigger another downswing.
It is no longer a secret that bad news spreads faster than good news. There is a risk that bad news will be priced in faster than good news.
With rising prices in the stock market, more and more money is needed to actually acquire the position, because the share is always more expensive. The application of these funds often requires a certain time. Selling is relatively easy, because no money is needed, but the money is posted back to the safe deposit.
Confidence always arises very slowly, but disappears very quickly. To invest money requires a share to trust. Investors who have put their money into funds, usually withdraw it only in the loss phase, since they no longer trust the fund. This forces fund managers to sell positions at unfavorable times to pay off investors. As a result, there may be further selling pressure in the market, driving prices further down.
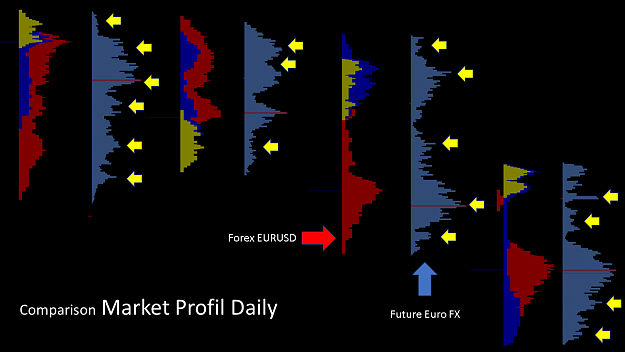
This behavior is typical for the stock markets and occurs again and again in certain market situations. Now I have asked myself the question, how this is in the forex currency market. When I buy the euro in the foreign exchange market, I sell the dollar at the same time, and when I buy the dollar, I also sell the euro. So, when I buy the euro, I expect prices to rise, and when I buy the dollar, I expect falling prices. I now wanted to find out whether there is a similar pattern of behavior in the EURUSD in order to gain insights.
Attached Image (click to enlarge)
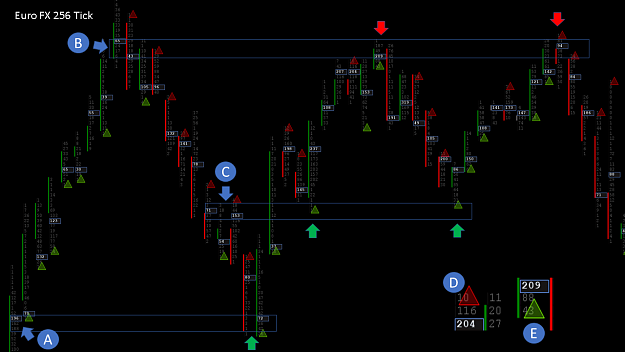
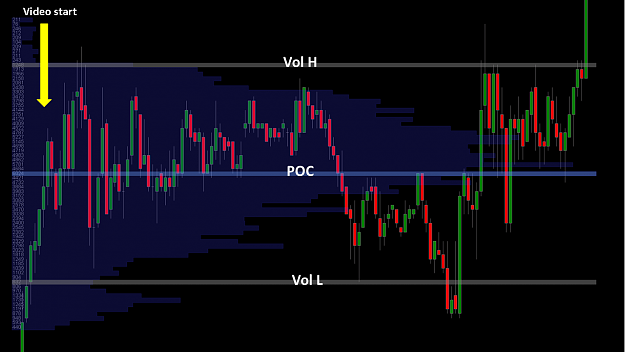
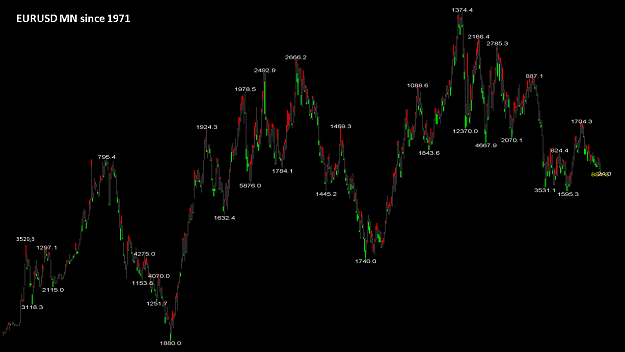
In order to be able to make a representative statement, I have examined a monthly chart of the EURUSD since 1971. A zigzag indicator with the setting 8/4/2 are used here. The numbers you see above or below the peaks indicate the average pipettes of a candle within each time period. In the last 558 months, there have been 17 uptrend and 17 downtrend. Let's take a closer look at these trends.
Attached Image (click to enlarge)
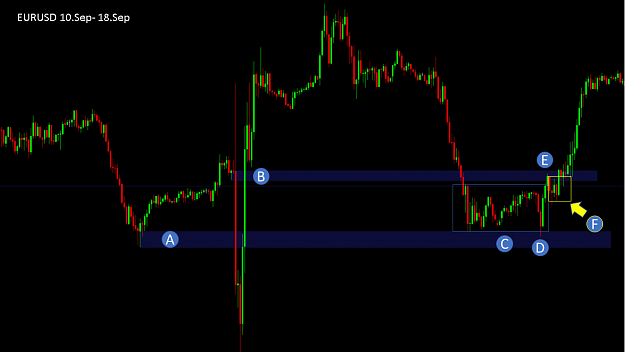
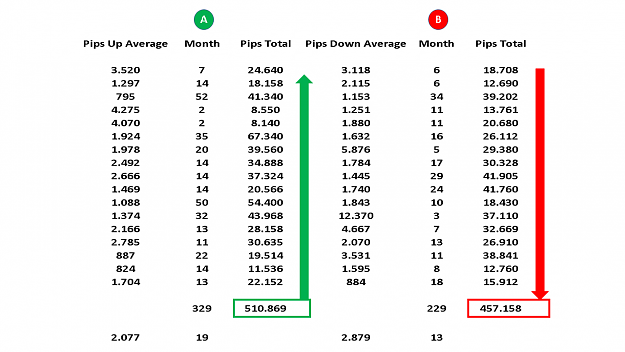
Under point A you can see the 17 different uptrends, under point B the 17 different downtrends within the last 558 months. The first uptrend in 1971 went over seven months and the candles had an average size of 3520 pipettes or 352 pip. Since the indicator represents the average number of pipettes I would like to use this in the following examples. Within 558 months, there were 329 months of average upward trends with a total of 510,869 pips. The downtrend was over 229 months with a total of 457,158 pips. The difference of more than 50,000 pips corresponds to the difference between the currently current price and the starting price from 1971. Already here we can already guess that the downward movements took place much faster than the upward movements.
Attached Image (click to enlarge)
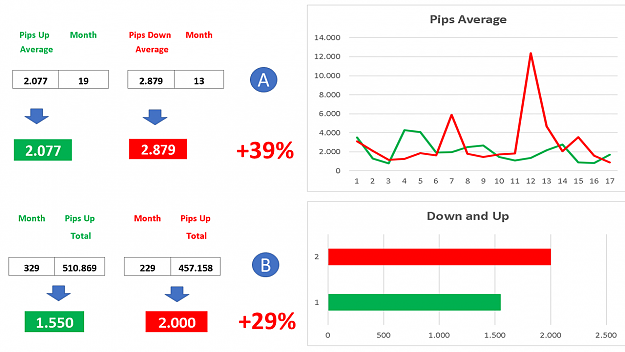
On average, an upward candle had 2077 pip for 19 months, while a down candle had an average size of 2879 pip for 13 months. This gives a result of 39%. This means that the bearish candle has gone down 39% faster on average than a bullish candle has gone up.
The uptrend lasted an average of 19 months while the downtrend lasted 13 months on average. Normally, within this equation, one would have to look at what the bearish candle would have achieved within 19 months in order to derive a concrete derivation, but I have renounced that for reasons of efficiency.
Under point B, I divided the total number of pips by the number of months. In the bullish movements we come to an average of 1550 pip and in the bearish movements we come to 2000 PiP, which on average has reached the respective candle. This is a result of 29% in favor of the bearish candle.
Conclusion:
Personally, with this comparison I can see that the downward movements are between 30 and 40% faster than the upward movements. This is an important insight because I believe that the longer you are with your position in the market, the greater the risk of being stopped out by an unexpected strong move.
If I put in this case only a downtrend within the EURUSD, I could reduce my time in the market by 30-40%. Provided that the price movement would continue to behave in the same way in the future.
Surely everyone can still remember the Franken Schock in 2015, where the price went down in seconds by 22,000 pipettes. For those of the traders who only bet on a downtrend, this breakdown would not have been a problem. The curious thing is that there has never been such an upward movement.
Inserted Video
For me personally, this question of security does not arise, since even as a professional forex trader, I can never lose more than my deposit within my brokerage account. But as a scalper, I have to ask myself which strategy I can best manage, within the shortest possible time, to negotiate my lowest risk trading. And the likelihood of reaching my goal faster is 40% higher in a downtrend than in an uptrend. Of course, this is not a reason for me to focus solely on downtrends, but it is an important insight, which advances me in my money management
Next week, I will put together the odds and assumptions, to make an interesting strategy to increase the overall probability of winning. This enables each of you to optimize your individual likelihood.
I wish you a nice weekend and a successful trading week
best regards
Forget:That does not work, amateurs build the ark, pros the Titanic!
9