i saw different people were using different tf and adr %. i know r4m's recommendation is M15 chart on D1 TF what about ADR% then?
Ignored
@Zkk -- please check out @bishopdotun's thread -- he's gone through a lot of effort to work out different settings, including %ADR. Here's a link:
https://www.forexfactory.com/showthread.php?t=930790
Just an observation : I used to check other indicators/ea`s by clicking TF W1 and then D1 again to check if it was still working. In that second the - allpairs EA - got W1 signals and buy/sell orders. When MT4 is settled on D1 again it exits the W1 trades again. Due to the spread they are closed in the minus offcource. Is that the correct explanation ? Just have to change habits (fyi still on version 19193 D1 live 2nd week)
Ignored
@Valuejager -- I'm not exactly clear what you are describing.
FYI -- whenever you switch between pairs and / or timeframes then MT4 forces the indicator (or EA) to exit and reload. As a result, all computations are repeated. So -- if there was an Entry signal or Exit signal and you switch away and then return, the Entry and Exit signals will be repeated.
{quote} @Valuejager -- I'm not exactly clear what you are describing. FYI -- whenever you switch between pairs and / or timeframes then MT4 forces the indicator (or EA) to exit and reload. As a result, all computations are repeated. So -- if there was an Entry signal or Exit signal and you switch away and then return, the Entry and Exit signals will be repeated.
Ignored
Hi R4M,
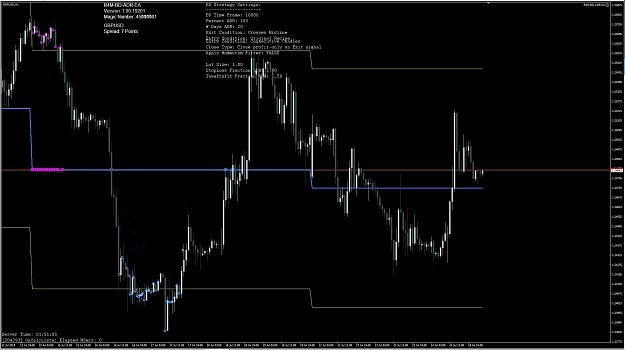
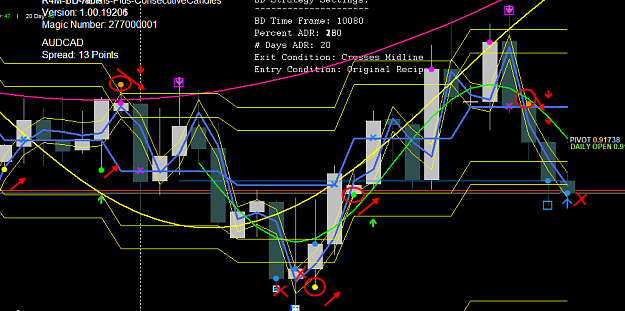
I am not sure if what I am about to report is related to the issue Valuejager is experiencing, but a number of times now I have returned to the chart and found it looking like the attached.
I have the EA and Indicator loaded with the same settings and the chart text looks uncluttered, but when left for a period of time (not sure it could even be once it receives the next tick) it looks like the chart I have posted and no I am not flicking between TF's.
When I check both the setting of the EA and Indicator, it is the Indicator which has reverted back to its default settings and made the chart text look cluttered.
Regards
RT
Attached Image (click to enlarge)
Some people say I'm lucky, but the more I practice the luckier I get
{quote} Hi R4M, I am not sure if what I am about to report is related to the issue Valuejager is experiencing, but a number of times now I have returned to the chart and found it looking like the attached.
Ignored
This is the same as I am experiencing a few posts back
Hi R4M. I am experiencing a bug where multiple incorrect signals and also lots of "x"s are showing up after some period of time. I have the
indicator loaded on 20 odd charts running 24/7 on a vpn. I finish trading with the indicator working correctly, then when I come back to check the charts ~10 hours later for the next session they look like this. {image} After I change time frame and back again it fixes itself. {image} This has happened 3 days in a row now, yesterday I went through every single one and switched time frame to fix it, and coming back today they are messed up again. This is not detrimental, but slightly annoying, also if I do not fix it, it will give new signals according to the original recipe, not fractals+cc which I have selected, until I change timeframe and back. Again not detrimental, but it means I can't take trades from my phone without looking at the charts, because I have to verify that it is a correct signal.
Just an observation : I used to check other indicators/ea`s by clicking TF W1 and then D1 again to check if it was still working. In that second the - allpairs EA - got W1 signals and buy/sell orders. When MT4 is settled on D1 again it exits the W1 trades again. Due to the spread they are closed in the minus offcource. Is that the correct explanation ? Just have to change habits (fyi still on version 19193 D1 live 2nd week)
{quote} Hi R4M, I am not sure if what I am about to report is related to the issue Valuejager is experiencing, but a number of times now I have returned to the chart and found it looking like the attached. I have the EA and Indicator loaded with the same settings and the chart text looks uncluttered, but when left for a period of time (not sure it could even be once it receives the next tick) it looks like the chart I have posted and no I am not flicking between TF's. When I check both the setting of the EA and Indicator, it is the Indicator which...
Ignored
Gentlemen -- thanks for the reports. I know what you are talking about -- I have seen it myself, but mostly at lower time frames. Also, when switching between time frames and pairs.
I think it is a drawing / charting issue. With each tick the indicator recomputes all markings. I think the extra marks you see were "real" at one time, but since bands shift then they should disappear and only the new mark remain. I don't see this as much when using W1 / D1 since shifting bands is less of an issue. I've made a small change to the code I hope will address this problem. Look for an update in a few hours.
With regards to "shifting" -- as a reminder, that is NOT the same as repainting. Another name for "shifting" is "recalculating". Recalculation is natural and occurs with each intra-band tick. The price changes with each tick -- hence those higher time frame (HTF), yellow steps will adjust accordingly. This is perfectly natural. It doesn't much impact trading, but visually it can lead to these graphical artifacts. We see it with the HTF steps because when they are overlayed on a lower time frame chart then it is the equivalent to zooming in and looking on them with a magnifying glass.
Anyways, I'll be curious to learn whether the problem persists in the next version.
I wanted to share an interesting observation about %ADR. This is nothing new and has been touched on before, but since we continue to question the value (and power) of the ADR then I decided write this post.
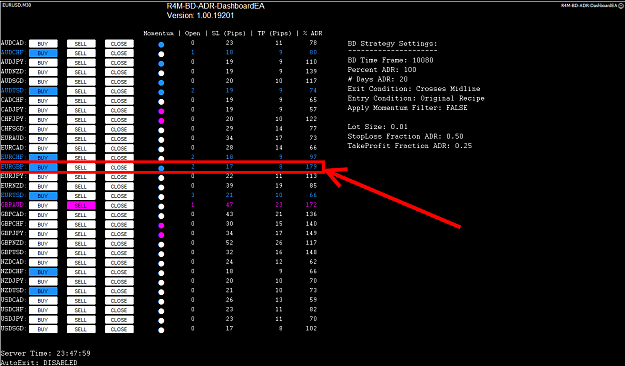
In the next version of the dashboard EA I added another column -- % ADR. That way, in a single glance, you can also see how full the ADR "cup" is. ADR is a really, really simple concept -- even simpler than a Moving Average (MA). If you aren't yet comfortable with ADR then you really should spend a few minutes to get your head around it. Also, it is the only metric in forex (that I am aware of) that can be used to predict the future. It lacks information about the 4th-dimenions (i.e. time), but it still offers an important edge.
Knowing the current % ADR -- i.e. how full the cup is -- is very useful for a reversal trading strategy. When the cup is only 25% full then the probability is low that a reversal will occur in the near future. But as the % ADR approaches 100% or even beyond, then the probability is high the price will reverse (since it always reverts to the midline (i.e. fair value, equilibrium).
In the screen shot below I've highlighted the line for EURGBP. You can see the BD strategy has detected an Entry BUY signal. Furthermore, the % ADR is 179% !!
Attached Image (click to enlarge)
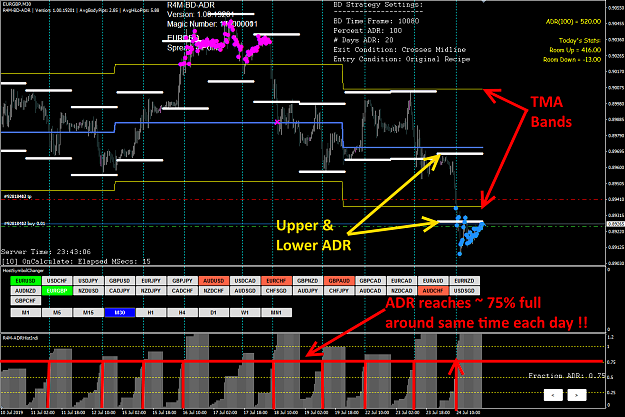
So, let's take a closer look. Below is a screen shot for EURGBP-M30 that includes both the BD indicator along with the R4M-ADRIndi and R4M-ADRHistIndi indicators:
Attached Image (click to enlarge)
Several points of interest:
* The dashboard EA works! It correctly detected a BUY Entry signal. You can see the blue dots (and arrow) below the lower, yellow TMA band.
* Also, look at the white ADR bands drawn by the R4M-ADRIndi indicator. You can see why the %ADR is 179% -- the price for today clearly exceeded the normal ADR.
* Furthermore, the lower (white) ADR band is below the lower TMA band. We know the price will always revert back to the midline. What do you think the probability is the price has a bullish move in its future?
* Look at the ADR histogram in the lower subwindow. Do you see how the ADR cup fills to around 75% around the same time each day? This was @rosalieone's observation back many posts ago.
* Collectively, this gives me tremendous insight into when to open a reversal trade. I want to wait until the ADR cup is mostly full (or even over-filled). Further more, I can see that this will probably occur around 0.75 through the current session.
* The combination of the price poking through both the BD strategy's TMA upper / lower band, PLUS the price poking above / below the ADRIndi's upper / lower band is a very strong signal.
* The white bands of the ADRIndi will move in tandem, up and down, as the ADR cup gets filled. But at around 0.75 through the current session then they will begin to stabilize and stop moving. So, if price is above / below a TMA band PLUS the ADR band is above / below the TMA band PLUS the price is above / below the white ADR band then it's as good as in the bank.
ADR Percentage I wanted to share an interesting observation about %ADR. This is nothing new and has been touched on before, but since we continue to question the value (and power) of the ADR then I decided write this post. In the next version of the dashboard EA I added another column -- % ADR. That way, in a single glance, you can also see how full the ADR "cup" is. ADR is a really, really simple concept -- even simpler than a Moving Average (MA). If you aren't yet comfortable with ADR then you really should spend a few minutes to get your head...
Ignored
Is this ADRIndi filter built into the blue magenta signals ?
Answer - No, Fractal and CC do the same job.
Request - Can we have all of that in shorter cycles ?
Response - No, ADR only works on daily and higher timeframes, play with % if you're into LTF.
{quote} Is this ADRIndi filter built into the blue magenta signals ? Answer - No, Fractal and CC do the same job. Request - Can we have all of that in shorter cycles ? Response - No, ADR only works on daily and higher timeframe.
Ignored
Quote
Disliked
Fractal and CC do the same job.
@skyway -- Good point.
But the ADR indicators are more "visual", whereas the fractal and CC markers seem to appear out of nowhere and it is not obvious how or why they were drawn.
Well -- actually, now that I think about it, there could be a bit more going on. Let's say a CC marker has a 75% chance of winning. It could be that a CC marker PLUS ADR marker (i.e. confluent signals) have an 82% chance of winning. I'm just blowing smoke. But when multiple indicators come together then the probability likely changes. Whether that change is significant and worth the added complexity, I don't know. But for manual trading I like the "visuals" provided by the ADR bands. And I know you do too because I see those white bands in some of your screen shots.
{quote} Hi R4M, I am not sure if what I am about to report is related to the issue Valuejager is experiencing, but a number of times now I have returned to the chart and found it looking like the attached. I have the EA and Indicator loaded with the same settings and the chart text looks uncluttered, but when left for a period of time (not sure it could even be once it receives the next tick) it looks like the chart I have posted and no I am not flicking between TF's. When I check both the setting of the EA and Indicator, it is the Indicator which...
Ignored
R4M, thank you to him.
I knew the starting point and turning point using the yellow line tma band.
hey ı think adr dashboard has a buge , when ı used only fractal as entry condition does not show all other pairs which has fractal , for example cad chf occured fractal but dashboard doesnt exist , do u know anyone why ?
R4M-BD-ADR.ex4 -- this is indicator work horse. The EA's get their signals from the indicator. R4M-BD-ADR-DashboardEA.ex4 -- dashboard EA for manual trading R4M-BD-ADR-EA.ex4 -- single pair, auto-trading EA R4M-ADR-AllPairs.ex4 -- multi-pair, auto-trading EA
I've uploaded new versions of the BD software -- one indicator and 3 Expert Advisors. This is now version "1.00.19206". The software can be downloaded from the other thread -- "Custom Indicators for TMA-ADR Reversal Trading and BBMA" (https://www.forexfactory.com/showthread.php?t=920925). All indicators are bundled in a single *.zip file. Indicators must be installed under MT4's 'Indicators' folder and EAs must be installed under the 'Experts' folder. To avoid version skews, please make sure that all indicators and EAs come from the same *.zip file.
So -- what's different? I fixed a few bugs and added a new feature to the dashboard EA:
* Dashboard EA -- added a column for % ADR currently filled.
* ADR calculation -- now takes into account your broker's server time. Depending on your broker's GMT server time, this could affect ADR calculations by as much as 20%. So now, when we compare results I'm hoping we can rule-out server time. BTW -- I checked many ADR indicators -- no one else takes into account server time. For us, the ADR calculation starts at the Asian Open. All other indicators assume the ADR starts at your broker's server time of 00:00.
* Indicator -- Fixed zombie markings -- I think / I hope...
* AllPairsEA -- fixed bug related to CheckNewBar() that prevented the EA from trading.
* Entry Conditions -- the Indicator continues to support 4 types of Entries -- Original recipe, Consecutive Candles, Fractals, Both Consecutive Candles and Fractals. The EAs support 2 types of Entries -- Original recipe and Consecutive Candles. @bishopdotun and I both recommend using Consecutive Candles for the EAs. Fractals can work well for manual trading, but it seems they still need some discretionary input -- hence the reason why it has been removed from the EAs (at least for now).
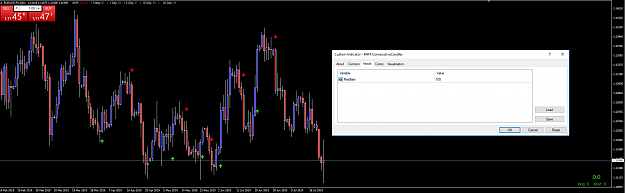
just a heads up for people having the same issue as me...
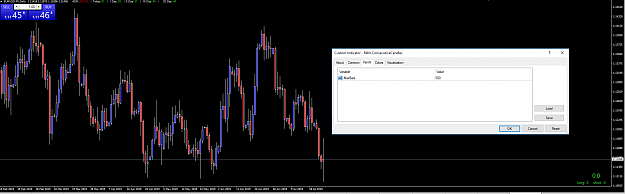
if your indicator is not showing any signals, try lowering the 'Max Bars' to a value within how many bars your charts show.
For example, I use broker IG. At the moment there are only 142 D1 bars of history. If I leave max bars at 500, there are no signals. If max bars < total D1 bars, then signals work.
i may be misinformed. haven't had this issue before.
just a heads up for people having the same issue as me... if your indicator is not showing any signals, try lowering the 'Max Bars' to a value within how many bars your charts show. For example, I use broker IG. At the moment there are only 142 D1 bars of history. If I leave max bars at 500, there are no signals. If max bars < total D1 bars, then signals work. i may be misinformed. haven't had this issue before. {image} {image}
Ignored
@alblive -- nice. It never occurred to me that might be a problem. I think I've run into this, as well. Thank you...
I forgot to mention that in the latest release I had added a setting called "UseFIFOCloseOrders". If you are using a US broker then you might try setting this to 'true' in order to avoid errors from the broker when multiple trades are closed.
Hello R4ME, daily original recipe the glass near full on highest ATR daily range pair, return to mean. This was the process identified early on and i see no evidence lower time frames work any better,