Forget:That does not work, amateurs build the ark, pros the Titanic!
Similar Threads
Harmonic Equilibrium Routing (MPA Based on HFT/ATS) 9 replies
Anyone been to success coach? 7 replies
Mini trading success 14 replies
My first success story...and what could have been a second 0 replies
- Joined Dec 2017 | Status: //houston ǝʍ have a probl | 2,398 Posts | Online Now
DislikedHi bionic. I got the information saying that equilibrium can be found just by using trendline. Do you have any idea on that?Ignored
There are many ways to identify an Equilibrium, one can even detect Equilibrium in a smaller time units with the eye. Equilibrium in the EURUSD arises when the buyers of dollars and buyers of euros agree. An equilibrium shows the fair price within a price zone. Equilibrium also means a fight for supply and demand. It is difficult to predict the course of the course within an equilibrium. Even a brief breakout from an equilibrium zone is no confirmation that the price continues in that direction.
I would like to comment on the statement that an equilibrium can only be identified by means of a trendline. Every trader has his personal strategy that he pursues. For the one who made that statement, it may be that way because he succeeds. And if he succeeds, it is right for him. I myself do not work with trendlines. In trading there is no right and no wrong. Everyone interprets the market for themselves, it is only bad if he believes that his statement must apply to everyone.
If you read through our blog from the beginning, you will realize that there are many ways to recognize an Equilibrium. What matters is what brings you the identification of an Equilibrium and what conclusion do you draw from it. In addition, identifying a trend is very difficult as we have to make a decision between Renkocharts, Candlecharts and Tickcharts within different time units.
Attached Image (click to enlarge)
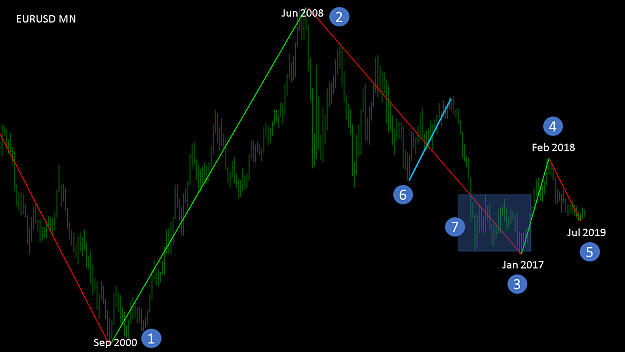
Let's look at an example in the monthly chart of the EURUSD. From September 2000 to June 2008 we had an uptrend. From June 2018 to January 2017 we had a downtrend. From January 2017 to February 2018, the price has gone up. Since February 2018, the price is in a downward trend. Now comes the exciting question. Is the price progression from point 3 to point 4 the beginning of a new uptrend, or is it just a pullback within the downtrend from point 2 to point 3? Finally we had a short pullback at point 6 and then the course went down. At point 7 we had a big equilibrium over two years as the price moved within a certain price range. This could be a possible indication of a new uptrend, but that is a pure speculation.
At the moment we are in a weekly chart in a kind of equilibrium, in the daily chart and in H4 possibly in an uptrend. In the H1 and the M30 we are in the downtrend and in the M15 and in the M5 in an upward trend. In the M1, it looks like we're in a pullback within a downtrend.
This means that we always find different trends within different time units. To make a concrete deduction from this is pure speculation. As a scalper, I am unable to give a long-term reliable forecast of a possible trend. The only advantage we have is to know that a course always moves up or down in wavy lines. We must identify these wavy lines correctly as traders and swim with the wave. Equilibrium can help identify certain resistance zones. However, the problem is that we do not get exact data in forex which gives us a closer look at the strength of a candle. Thus, the speculation in the forex is much greater than in the futures market.
I have compared the forex market in the last few weeks with the futures market, there were very interesting findings. For this I will publish a detailed report in the next few days.
I wish you a nice weekend
best regards
Forget:That does not work, amateurs build the ark, pros the Titanic!
2
im not sure if that's right but seems like those number mean something about equilibrium price..as you can see the bear and bull are draw in average for 100 candles ...so lets get some closely look wich candle get a 4 pips ....
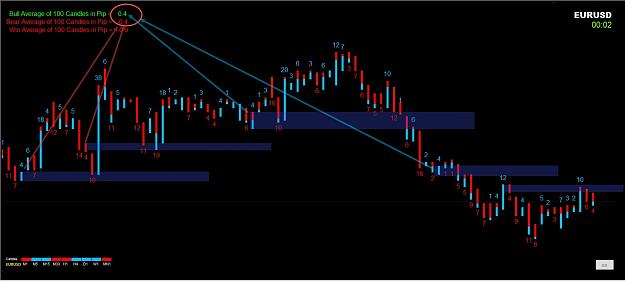
awesome and little bit inscrutable... some time the price respect the level of number 4 some time no!!!
do you have any information can get better understanding ?
Attached Image (click to enlarge)
awesome and little bit inscrutable... some time the price respect the level of number 4 some time no!!!
do you have any information can get better understanding ?
- Joined Dec 2017 | Status: //houston ǝʍ have a probl | 2,398 Posts | Online Now
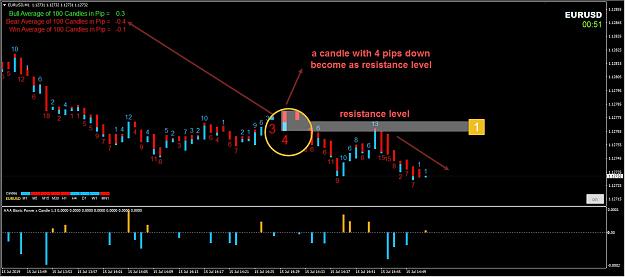
Disliked{image} Sir I'm sure this is not a coincidence ...that's kind of equilibrium point very clear ....but the question is which candle more powerful 4 pips with pullback or 4 pips without pullback?Ignored
a possible answer might be in my next in-depth review.
Lovely wishes
Forget:That does not work, amateurs build the ark, pros the Titanic!
- Joined Dec 2017 | Status: //houston ǝʍ have a probl | 2,398 Posts | Online Now
Forex versus future
Hello dear subscribers,
Today's report is about the differences between the forex market and futures. The most important backgrounds are illuminated and some very interesting findings came out. Therefore, this report has become slightly longer than usual.
For many years I work full-time as Forex Scalper and use this platform with FF for me as a kind of development diary. I am neither a trading guru nor do I want to convince others of my way of trading. The background: In the last few years I realized that it is an advantage to be able to reread my thoughts that I had in the past later. I have found my basic strategy for myself and live from my business, but I am motivated to optimize this strategy every day. It took me many years to realize that supply and demand are the only way for me to be profitable. When you write down your insights, new aspects come up, which you scrutinize and analyze. It took me almost a month to develop this report today.
Of course, an exchange takes place within this blog and I like to help where I can. Likewise, I explain to interested subscribers how I proceed, with much intuitive and I want to make this intuition in this blog for myself to understand. This is the same when a racer is to explain exactly how he approaches the vertex of a curve optimally. I make no claim that I am right or that my view of the market is correct. Nevertheless, my way of trading is absolutely correct for me, since I live from trading for many years. Since I follow through this blog no financial interests, I do not have to prove my success. My motivation within this blog is to take ideas, develop them and then make them available to everyone. That's how everyone gets ahead. I realize that my way of doing things is not standard or normative. A trading strategy that has been developed for yourself over many years is always difficult for an outsider to understand. This blog is primarily about supply and demand. This ensures that only the type of subscribers who want to trade supply and demand on this blog sign up. Traders who expect a profitable system with functioning indicators, will not feel comfortable here. This leaves exactly the traders who continue to develop this blog and bring it forward.
This blog helps traders to develop themselves. It's a kind of buffet, you can eat what is fine. There are many systems that can be successful, but you can not copy a system 100%, because experience is the most important aspect. Even if someone were to act according to my system, it would always be different. There is no indicator that tells us what to do, you have to listen to your experience. And experience always needs its time.
Through exchanges with some subscribers, over the last few years many good ideas have come together that I have developed within supply and demand and then made available to everyone again. Quit pro quo, one hand washes the other. The market is not easy, although the price can only go up or down, the odds are effectively only 1:19. Why this is so, I will explain later exactly. Let's first look at the forex market.
Interbank Market
The interbank market is the market where money and credit business takes place only between banks. Banks and financial institutions trade with one another in the interbank market, lend each other money and can thus ensure that they remain liquid. Securities, money, foreign exchange, precious metals or derivatives are exchanged in the interbank market. The interbank market is assigned to the money market. The rates of currencies are not determined by a government as long as they are freely tradeable and not linked to another currency. They are based solely on supply and demand. Forex trading is usually OTC, i. E. it is not centrally organized, but takes place directly between the market participants or through a broker.
Bank risks are to be spread across the interbank market. Through it, the banks can carry out liquidation of open positions that were previously established in the customer business. Or the banks operate proprietary trading on the interbank market. In addition, interbank trading should ensure sufficient liquidity at all times for the banks.
The biggest "players" in the forex market are governments and the central banks, which generally participate in foreign exchange trading in the interests of the government. Due to their financial capabilities, central banks are able to exert a noticeable influence on the foreign exchange market. In principle, however, they use currency trading only to adjust and hedge their foreign reserves. The next largest participants are banks and other credit institutions. The proportion of private speculators is very low here in comparison.
EBS (Electronic Broking Services) is the world's largest trading platform for foreign exchange in interbank trading. The price, which arises at EBS, is the reference for any FX derivatives. EBS Markets maintains an anonymized central limit order book. FX trading banks can trade on the market and trade via these hedge funds & CTAs (Prime Brokerage Arrangements). Although the data is collected anonymously, EBS Markets recognizes whether it is a human or an algorithmic interface (AI). In addition to the classification, the EBS regulations provide for a minimum quota life (MQL). This is to prevent the high-frequency traders from the fact that they have only by their speed advantage over the other market participants. In addition, since there is no specific trade information in the interbank market, this market for high-frequency trading is not quite as interesting as the stock market environment.
The big players therefore have sophisticated computer systems to detect inconsistencies in the currency pairs. These inconsistencies usually last only a few seconds. With so many market participants and the large volume of daily sales, it is more important to keep an eye on the trend and the flow of capital than to recognize an undervalued currency. The cash market is the so-called Leitwolf, it is based on all markets. When the EURUSD course is mentioned on television, it is always about the cash market.
Over $ 5 trillion is being transacted daily in the forex market. By the end of 2019, the $ 6 trillion limit is to be reached. This would have increased the volume of 1995 almost sixfold. In 24 years, the Forex market has thus achieved an average increase of 7% per year.
The EURUSD trades around $ 1.7 trillion per day and the retail trader share is around 5.5% = around $ 94 billion. Worldwide there are about 5 million traders and about 50,000 institutional traders. If 1 million traders per day trade the EURUSD, the average turnover would be 1 lot. Assuming that 10,000 global institutional traders per day trade in EURUSD, their average turnover would be around 1200 per day. This quickly reveals the unequal distribution of powers. The big players act and the retail traders react.
The interbank market has repeatedly come into disrepute, as banks had made price agreements with each other, which had a negative impact on other market participants. In addition, foreign exchange trading almost led to fraud: 98 percent of transactions are conducted in direct trading between banks rather than via a stock exchange. There is no regulatory authority. Only twelve banks control 85 percent of the market. Banks do not trust each other and no one provides information about their trading activities. Therefore there is no real volume or an order book in the interbank market. The resulting volumes in MT4 are a pure estimate.
That's exactly the difference between the two markets. On the stock exchange all market participants have the same extensive information. In Forex market, most market participants have insufficient information. With a trading volume of over 21% in the interbank market, Deutsche Bank has so much experience that analysts and programmers are able to develop interesting strategies from the existing data. This brings clear advantages in the trade. With an average daily sales volume of 3,600,000 plumb bobs, they simply have more background information than the small retail trader. In addition, the Big Boys spend billions on their analysts and traders. A truly successful trader earns millions of dollars a year in these financial firms, after all, he should not have to worry about financing his house, his cars and vacations. He should be free in his mind and concentrate 100% daily on the market.
It scared me that some banks are investing 20-30% of their available funds in the forex market and with that gaining up to 65% of their yearly total profits. So, if you make a bank transfer again and it takes 2 days to land on the other account, it could well be that, among other things, this money is being used in the EURUSD to fund a breakout that may even stop you.
MT4 is the world's most popular forex trading platform. His next competitor is the MT5, which, as the name suggests, is also built by MetaTrader. It is conceivable that even some larger traders will work with this platform in the forex market.
Nevertheless, the forex market is more opaque to the retail trader than the exchange-regulated market.
Futures
The buyer of a futures contract undertakes to buy the underlying asset on the due date at the agreed price. The seller of a futures contract, however, to sell the underlying asset on the due date at the agreed price. At first glance, futures trading thus does not differ from ordinary cash markets, such as the stock market.
But there is one major difference: futures are related to an Underlying, and their Derivative Market price-depends mostly on the spot rate. The price of the Euro FX Future is always slightly above the spot rate of the EURUSD. There is a simple reason for this: if an investor buys the EURUSD on the cash market, he must pay the entire purchase price immediately. On the other hand, if he opens a long position in the Euro FX Future, he only has to deposit a fraction of the current market value as collateral for the futures exchange.
The difference between this margin and the full market price may be invested at a safe interest rate. The returns to be achieved with this safe interest rate correspond to the price difference between the spot rate and the forward rate. Investors can basically trade two different motivations futures. Firstly, futures trading is suitable for speculative purposes because capital investment is low, liquidity is high, and the range of tradable markets is ready. Second, futures are suitable for hedging economic or financial risks. A farmer can sell the late summer corn crop at a fixed price as early as spring, and a portfolio manager can hedge a stock portfolio against general market risk.
Futures trading also offers several benefits to private investors. First, almost no other financial instrument makes it so easy to speculate on falling prices. For this purpose, only a short position must be opened in futures trading, while short sales in equities are only relatively cumbersome. Futures offer much simpler pricing than options, where residual maturity and volatility sometimes influence the option price more than the actual performance of the underlying.
Second, unlike certificates and contracts for difference, investors can be confident in trading futures on a futures exchange of regulated and closely supervised settlement. The business model of many brokers and issuers is precisely to pass on the bid / ask spreads of the futures market at a premium to their own customers. Third, futures trading requires very little capital investment compared to a direct investment in the underlying asset. This allows trading to leverage: Investors can move many times their assets in the market and thereby generate disproportionate returns relative to their use.
The Chicago Mercantile Exchange (CME) announced in early January of this year that it would reduce the tick size for the futures contract to EUR / USD from one pip ($ 12.50 per contract) to ½ pip ($ 6.25 per contract). With this measure, the CME makes the Euro FX future even more interesting, especially for day traders and scalpers.
Futures Trading has a large selection. The exchanges offer forward contracts on stock indices, individual stocks, bond indices, volatility, exchange-traded index funds, interest rates, commodities, exchange rates and even real estate prices. Even if the individual contract specifications differ, the actual trade always runs the same way.
Who sets on rising prices in, opens a long position. If investors expect falling prices, a short position will be opened. In this case, it is an opening position. Even though futures are unconditional forward transactions with a concomitant obligation to buy or sell, it is very easy to exit the market. Investors open a closing position. A short position is closed by opening a long position with the same number of contracts. The market risk is completely eliminated and the investor acts as if he had not previously opened a position.
The performance of the futures depends exclusively on the performance of the underlying, the margin on the futures exchange, the market interest rate and the remaining term of the contract. As a rule, the price of the futures is only a few points above that of the cash market. In the FX Future, the minimum bet is 1 lot ($ 125,000), a tick is 0.5 pip and thus the volatility is slightly lower than in the Forex market. Depending on the broker, leverage is possible up to 200. The minimum deposit is $ 5,000 for most brokers and there are also brokers who charge significantly less. However, this is not recommended, because a futures account under $ 20,000 makes no sense to me.
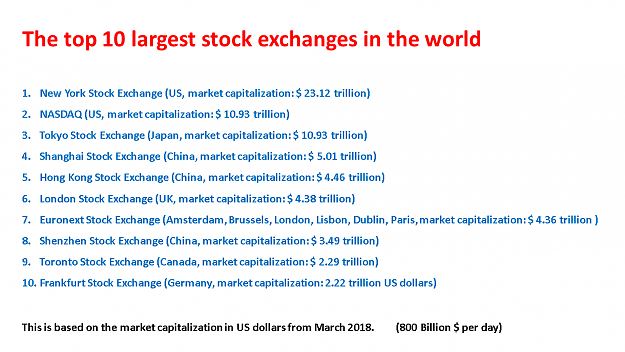
More than $ 800 billion is being transacted every day on the world's top 10 exchanges. By the end of 2021, the $ 1 trillion limit could be reached. The forex market is 12x larger than the futures market and 27x larger than the stock market. Since only professional traders trade in the futures market, there is no such thing as the typical retail trader. Of course, there are big players, and especially the dreaded high frequency traders, who are quite different from the smaller traders.
In the regulated stock market, price fixing which had a negative impact on other market participants is more difficult. There is a real volume and an order book in the futures market. All market participants have the same information. The key is the interpretation of this information.
The MT4 does not work on the Future markets, however, the MT5 can be used here, which is too confusing for me, however. A Ninja Trader already has clear advantages but is not as clear as the platform ATAS, which, however, costs a one time $ 2,500. What matters is what information you need for your trading strategy.
Before we start with a comparison between the forex market and the futures market, we first look at how difficult it is to survive in the different markets.
Which markets are particularly hard to trade?
Since 1984, the World Cup Trading Championships (WCTC) holds a Trader World Championship every year. There are different categories whereby I would like to compare only 3 categories stocks, Forex, and Future. The rules are simple. All participants who want to participate in the same broker open a trading account with $ 10,000 in the future or $ 5000 in the forex. Traded only with real money over a period of one year. Every trader can individually trade from home within this year. There must be at least ten round-turn trades. At the end of the period, the three winners with the highest net return are determined. Some traders trade at very high risk, and some drawdowns are above average speculative. However, everyone in this contest has the same opportunities to compare each category. The returns are not representative but provide a rough guide as all participants have the same requirements.
On the right side you will see a table where the respective World Champions are listed in each category. The period is between the years 2000-2019, with the figures from 2019 being an intermediate, as the competition will run until the end of this year. The average return across all categories is 190% per year. That such a return can only be achieved with an increased risk in the trade, everyone should be clear.
Although we only need the forex and futures markets for our comparison, I included the stock market for additional comparison. Incidentally, I have used all the figures that have been provided to me.
Equities
In terms of equities, an average performance of 81% per annum was achieved within eleven years
Forex
Forex has achieved an average performance of 106% per annum over eleven years
Future
In the area of futures, an average performance of 308% per year was achieved within 18 years
Conclusion and knowledge
In my opinion, the stock market is one of the most difficult markets you can trade on the stock exchange, because a lot of background information is needed for a good performance. In addition, you have to be able to interpret a trade balance correctly and read between the lines. A return of over 81% is an absolute top performance in this market segment.
Let us now compare the forex market with the futures market. Basically, it is striking that the yield in the futures market is almost three times higher than in the Forex market. The best return in the forex market does not even match the average yield of the futures market. The 5 worst returns in the futures market correspond to the average yield in the forex market.
The fact is that the yield in the futures market is three times higher than the yield in the forex market. However, it should be noted that in the forex market trades very many beginners, while the future market is used almost exclusively by professionals and experienced traders. Many traders who started in the forex market trade now in the futures market.
Since the forex market is the interbank market, where banks trade with each othernot in a regulated market, it should be clear that the challenge in trading there is significantly higher than in the futures market. Based on the numbers, it can be assumed that trading in the stock market is almost 4 times and in the forex market is three times as heavy as in the futures market. This is basically an important insight, if you are in one of these markets.
Many believe in the beginning of their trading career that the chance of winning is 50%, as the price may only rise or fall. But that is a mistake. 95% of retail traders lose their money over a long period of time in the forex market. The profit probability of retail traders is thus 1:19. Take 19 cards, place them on the table and pick a specific card. Now close your eyes, shuffle the cards and draw a card from the stack. If it is the previously chosen card, you have won.
The losses are so inevitable and no one should be sad if he loses, that's completely normal. The only chance is to get closer to the market every day through personal experience. This only works if you limit the losses severely and act more defensively than aggressively. As a rule, one lets losses run too long, because one hopes that the market comes back again. Profits are taken too fast because you do not want to give back your win. And then there are the revenge trades to recover his losses. These are typical human habits that you should quickly forget as a daytrader or swing trader.
If you start as a beginner in the EURUSD Seconds Chart with Scalpen and make your entries and exits dependent on indicators, the loss is a sure thing. If you start with table tennis, the ball at the beginning is also played slowly back and forth to get a feel for it. Over time, you become safer and able to accelerate your game. If, as a beginner, you face the multiple table tennis world champion Ma Long from China you will not win a game.
When trading our opponents are almost exclusively world champions, but since many beginners sit in front of their screens, and the opponents do not see, most believe that you have a real chance. If a beginner could see the professional traders of the banks, the initial losses would probably be much lower. The problems are the many self-proclaimed trainers who have no idea about the trade, who pull the money out of your pockets and let you believe that trading is easy. It recommends strategies that could be downloaded for free from the internet. Add to that the many trading books that are recommended on the internet and are actually worth a penny. I was fortunate to not read any of these books at the beginning. When, after a few years, with some experience, I took these books in hand, I was glad that I could not orient myself to it.
The forex market is three times heavier than the futures market, it is crazy that a beginner starts in the heaviest market and when he has success, to move into the lighter market. Normally it should be the other way around.
Comparison Forex Market / Future Market
In the following comparison, the EURUSD in Forex is compared to the Euro FX E6 Future. As I already wrote, these are two completely different markets, which also differ in pricing. Nevertheless, the futures market is based on the cash market, which means that the markets are indirectly linked.
As we already know, $ 1700 billion is being converted into EURUSD Forex per day. At a Lot value of $ 100,000, this equates to an average daily turnover of 17 million lot. In the futures market, 1 lot equals $ 125,000 in sales. From the stock market data of the CME we can see that on average 150,000 lot are traded per day in Euro FX. That's equivalent to $ 18.75 billion in revenue. The Euro FX Future is 90 times smaller than the EURUSD Forex.
Volatility is significantly higher in the forex market at 0.1 tick than in the futures market at 0.5 tick. In the forex market, the leverage for a non-professional trader is 30, while the lever in the futures market can be up to 200. Both accounts can be opened by beginners, whereby the advantage in the Forex market is that a trader maximally can lose his deposit. With his Trader account he does not run into the minus. In Europe, it is much harder to gain a professional trader status in the Forex area than in the futures market. Only about 4% of all forex traders in Europe achieve these special conditions.
Let's come to a key point: the profit and loss ratio. The probability to win in the forex market is 1:19, as 95% of retail traders lose permanently. Assuming that it is three times easier to make profits in the futures market, there would be around 85 losers for 15 winners. The odd is 1: 6. This ratio could potentially be very realistic, as the futures market is almost exclusively made up of experienced traders.
An interim conclusion:
Looking first at the two different markets, we find that we are gaining 61.5% in the forex market, while the futures market is up 38.4%. This is primarily because the entry criteria in the forex market are easier and the security is much higher.
The fact that one achieves three times higher profits in Future market than in the Forex market, lies essentially in the fact that one gets more concrete market data available in the Future market. First let's look at the market data, which disadvantages there are in the Forex market.
In the forex market, we do not receive a specific volume (number of lots) or a specific number of completed trades. Therefore, there can be no Dom and no Time & Sales list. It is also impossible to display a footprint chart, a volume profile, deleted lots in the dome or an imbalance in bid and ask. For this, the largest banks would have to be willing to publish their data. And that is exactly what will never happen in the forex market. Due to poor data information, the forex market comes to an advantage of 30.7% while the futures market comes to an advantage of 100%. This makes it clear that the futures market has over three times more information than the forex market.
If you add all the advantages together, the forex market would come to 90% while the futures market gets just under 140%. We realize there is no clear market that only has benefits. But a smart trader tries to optimize the benefits and minimize the disadvantages. First, let's see if such a strategy is even possible.
As we know, there are different prices in the EURUSD Future and Forex market. In the picture above we see the Future FX market in H1 and in the lower picture the EURUSD H1 in the forex market. If you compare the candles, you will find that the differences are marginal. And yet the prices are different. This realization is very important to make a further decision.
I compared the data feed of the futures with the data feed of the Forex market over several months and found that the data feed of the futures had significantly more problems. But that could been coincidence. I myself have a very fast data feed in the forex market, which runs very stable even with strong volatility.
The cost of a lot for me are significantly cheaper than in the futures market. On the Forex market I pay average $ 4- $ 4.5 per roundturn per lot, between $ 5 and $ 10 in the futures market. With 200 trades per month, that's a big difference.
The chance to win in the forex market is 1:19, while the chance in the futures market is 1: 6. Consider, for a brief moment, the opportunities that result. A winning chance of 1:19 means that the trader wins, what the other 19 traders loose. In the Future Market, the winner receives the money from 6 traders who have lost.
We must note that in the Forex market 90 times more money is converted than in the futures market. Let's just do it all down. The forex market is $ 1700 while the futures market is $ 18.75. Thus, it is clear that the profits in the forex market in the ratio are significantly higher than in the futures market. In contrast, of course, there is the much higher risk.
The ESMA regulations made me register a year ago as a professional trader within the Forex market. Since I can never lose more money than I have in my account, in the event of an uncontrolled breakout, my account will not go down. A possible minus account is excluded. That has kept me from trading futures. With the franc shock in the EURCHF, a few years ago, the price went down by 2200 pip within a few seconds and plunged many dealers into misfortune. Anyone who believes that such a thing can not happenmore, is wrong. At the beginning of 2019, some of the prices dropped 700 pips within minutes. So, if someone had just set five lot on a rising course, he would inevitably have been dragged down. In these fast movements, it is questionable when the first buyers come back into the market and the stop finally starts. In the most extreme case, that would have been a minus of $ 35,000. Had the account been $ 15,000, a $ 20,000 back payment would have been due. In my case, I might have lost a maximum of $ 2000. This is a crucial aspect that should not be neglected.
The typical business model of retail brokers is in most cases not suitable that customers make money. It is crucial that one can recognize potential conflicts of interest of the brokers. The danger is that the forex brokers usually know very well where customers are stopping, and that the prices are being pulled up or down around one or the other PIPs to "fetch" those stakes. Compare once in the cash market in EURUSD the highs and lows on major chart brands. If the cash market prices deviate too much from the broker, you should investigate more intensively and possibly change the broker.
Since I have multiple accounts with my broker, I can shift my money within seconds if I want to market with a higher number of lots. In the same way, I can again take my money from the risk area (my current trading account) and transfer it to the second account. In case of a uns in the 1 Tick Chart. Since I trade in the forex market, the specially created Time & Sales list helps me a lot more than thstrong drawdown, the secondary account is not affected. I basically work with virtual orders and stops that my broker can not see. In recent months, the market orders were clearly in the advantage, often I'm so fast in the market and out again that the broker would have no chance to chase me in the stop. Although I believe that the manipulation with an ECN broker is rather not given.
What remains at the end is the chance to win. In the futures market, the probability is three times higher than in the Forex market. We have already analyzed the reasons in detail. The reasons for the higher odds are the much better and more accurate data. Let's first look at the data we can get in the futures market.
At point 1 we see the Time & Sales list, which is going down relatively quickly in periods of high volatility. In the middle of this list you can see the number of lots traded within one tick. The representation, the displayed Lot is not optimal. For me it is a significant difference if 1 lot or 20 lots were traded in one tick. Accordingly, the Time & Sales list should be adjusted accordingly. For the forex market I have built up a time & sales list, in the form of a graphical representation, which re list from the futures market. I will publish an extra post in the next few days.
Under point 2 you will see a way to view the cumulative trades that were carried out on different price zones. This presentation does not help me personally, but you have many options to change the presentation form. Under point 3 you can see a footprint chart in two different tick charts. This is a very interesting form of presentation for me, which gives me a clear advantage in the trade. Under point 4 we see the DOM. Many Forex market traders believe that this DOM is the holy grail, unfortunately this is a fairy tale. Point A shows the current price in the market and the spread (Level1). Point B shows an inventory of current buy and sell orders. In the context of this list, the entire folders are arranged according to their limitations. (Level2) Unfortunately, this is just a so-called limit order. However, this view is only half true, since the market is essentially determined by market order. The come, however, without notice in the market. Likewise, no stops are displayed in level 2. Point C shows the orders that have moved the price. This information is very interesting and can be found in the footprint chart again.
A big problem is the so-called spoofing. Many traders orient themselves on the Oderbruch to see at which level there is greater buying or selling interest. Often, larger dealers place orders in the market and thus fool a buying interest. Just before the limit order is picked up, it is deleted again. Under point D you can see exactly these deleted orders and immediately find out at what level a spoofing has taken place. Under point E you will find the volume of the current day and under point F the volume of the previous day, but this can be adjusted individually.
The following overview shows a footprint chart in the 512 tick chart. On the left side you can see the accumulated volume, on the right side the Oderbuch Level 2. The red and green bars represent the respective movement between Open and Close. Unfortunately there is no Bioniccandle in this area, which may change in the future could. Inside a candle you will see two different numbers. The left number represents the settled bearish lot, the right number represents the settled bullish lot at a certain price level. The colored numbers indicate the imbalance in the market. BIDxASK Imbalance is a way to read the volume. It makes it possible to measure the difference of executed market orders on BID and ASK via a percentage filter and thus to see more aggressive market participants. As you can see in the graph, aggressive buyers are shown in green and sellers in the chart in red. Correspondingly, market reactions can occur again at these "aggressive" price levels. The imbalance in a chart, recognized in advance, can help you use relevant prices where there was aggressive pressure from buyers or sellers to time your entries and exits. These key areas show us the intentions of aggressive market participants and we recognize the prices at which the buy or sell activity begins. Resets to the relevant prices show here in the screenshot a clear reaction in favor of a bullish continuation. It is assumed that markets are driven by the positioning of institutional money. This can be seen by studying the large orders / volume. The BIDxASK Imbalance Chart gives us the advantage of not positioning ourselves against the prevailing order flow. Also at point 1 you will find two red colored zones. A very interesting algorithm searches out the strongest movements in the market and marks them. This form of presentation of the footprint chart is interesting in that one can immediately recognize at certain resistance zones whether strong buy or sell orders are absorbed.
Here we see another illustration in the 512 tick chart. The numbers on the left represent the number of the volume, the numbers on the right represent the number of completed trades. From this one can draw very interesting conclusions.
In this form of representation, the volume in a candle is exactly divided within the tick chart. This allows you to see the strength within the candle relatively quickly and to deduce possible conclusions about a future resistance range.
The same presentation as in slide 9, but here the volume was divided into bearish and bullish movements. The candle thickness can be seen even faster in this area.
Basically, I still record my resistance zones in the forex market within a 16-tick chart. As soon as the price reaches my marked resistance zone, I collect the data from the futures market. If I realize that very strong buy orders are coming in, but they do not lead to any price changes, I can assume that a larger player will absorb these buy orders. This approach increases my likelihood of predicting a trend change more reliably. However, it should be noted that I am a scalper only very short in the market and thereby achieve significantly higher profit quotas. It is also very interesting when the futures market often runs three times in a row at the same price, while the forex market ends in different prices. This is because the Future needs 0.5 pip per tick and the Forex 0.1 pip. This gives me much more accurate information in the forex within the price. That's crucial for a scalper.
Neither of the two markets is leading, so it could generate a potential advantage. The only advantage in the futures market is the deeper market insight that can be implemented well in the forex market. However, you only have an advantage if you have already marked your resistance zone within the Forex market. The procedure becomes very interesting, if one acts within a strong upward trend, the countertrend. If you have a particular zone in mind, you will need a medium term and short term confirmation that this particular zone is relevant. I've already shown you a few ways in different blogs to analyze the trend strength within specific time units. It should be noted that the confirmation usually take only a few seconds. If you hesitate too long, the chance is over quickly. Every trader has his own strategy and approach here. However, this additional information from the futures market is not cheap.
When a big player pushes the price up, he buys the euro and at the same time sells the dollar. The problem of big players is often not the entry, but the exit. So he needs enough traders willing to buy him the euro. So he searches the stop zones of retail traders. Right there he finds enough customers and can repel his order within a short time.
A big challenge is the differentiation of different orders in the market. A price is in an uptrend and suddenly there is a turnaround and the price is going down. Now there are three options. Pullback, trend reversal or equilibrium. Either somebody sells his previously purchased euro because he wants to realize the profit, or somebody buys the dollar because he thinks the price falls. In the third case, there is a struggle between buyer and seller within an equilibrium. Of course, there are different ways of acting in each price level, the key is to identify the strongest key player. Unfortunately, most come at the last moment with a quick market order. Although much more information can be obtained with the data in the futures market, this information is also severely limited.
In recent years, more and more coaches have entered the market who have sold the footprint chart and volume profile trading as a Holy Grail. There is no way to predict the market, as this market is purely coincidental. Although there are always the same processes, but also these processes wear off over time. Once many traders can identify certain processes, the big player has to come up with a new strategy. It's always about it. Deceive, camouflage and cash in. Since I act in very short time units, I can often take the fast movements with me. With small stops of 0.5 pip the losses are limited.
In a tick chart the differences between forex and futures are clearly visible, while in forex 5 movements take place, there isonly one movement in the future. I do not want to suggest that you should trade Forex with information from the future market. For my trading style, the information from the futures market seems to be worthwhile, whether this will last, we must wait and see.
Professionals act and anticipate, the retail trainers react and help with their stops the professionals to leaving. Professionals work strategically and follow the money and volatility while retail traders give up as soon as their strategy stops working. All who climb into the boxing ring must know the rules and know that they face a world champion. The unfair is that when the big player hits us, it hurts a lot. If we hit the big player, he probably will not even remember it. That's why we often leave the boxing ring with a black eye.
In principle, changes in exchange rates arise through the supply and demand behavior of the market players. Exchange rate changes have great macroeconomic significance and therefore play an important role in economic policy. Looking at changes in exchange rates over time, it can be concluded how market actors assess the development of an economy. A currency undergoes an appreciation when its price rises in the foreign exchange market; there will be a devaluation if their price on the foreign exchange market falls.
Who knows that and takes care of it, is already a long way ahead.
best regards
Hello dear subscribers,
Today's report is about the differences between the forex market and futures. The most important backgrounds are illuminated and some very interesting findings came out. Therefore, this report has become slightly longer than usual.
For many years I work full-time as Forex Scalper and use this platform with FF for me as a kind of development diary. I am neither a trading guru nor do I want to convince others of my way of trading. The background: In the last few years I realized that it is an advantage to be able to reread my thoughts that I had in the past later. I have found my basic strategy for myself and live from my business, but I am motivated to optimize this strategy every day. It took me many years to realize that supply and demand are the only way for me to be profitable. When you write down your insights, new aspects come up, which you scrutinize and analyze. It took me almost a month to develop this report today.
Of course, an exchange takes place within this blog and I like to help where I can. Likewise, I explain to interested subscribers how I proceed, with much intuitive and I want to make this intuition in this blog for myself to understand. This is the same when a racer is to explain exactly how he approaches the vertex of a curve optimally. I make no claim that I am right or that my view of the market is correct. Nevertheless, my way of trading is absolutely correct for me, since I live from trading for many years. Since I follow through this blog no financial interests, I do not have to prove my success. My motivation within this blog is to take ideas, develop them and then make them available to everyone. That's how everyone gets ahead. I realize that my way of doing things is not standard or normative. A trading strategy that has been developed for yourself over many years is always difficult for an outsider to understand. This blog is primarily about supply and demand. This ensures that only the type of subscribers who want to trade supply and demand on this blog sign up. Traders who expect a profitable system with functioning indicators, will not feel comfortable here. This leaves exactly the traders who continue to develop this blog and bring it forward.
This blog helps traders to develop themselves. It's a kind of buffet, you can eat what is fine. There are many systems that can be successful, but you can not copy a system 100%, because experience is the most important aspect. Even if someone were to act according to my system, it would always be different. There is no indicator that tells us what to do, you have to listen to your experience. And experience always needs its time.
Through exchanges with some subscribers, over the last few years many good ideas have come together that I have developed within supply and demand and then made available to everyone again. Quit pro quo, one hand washes the other. The market is not easy, although the price can only go up or down, the odds are effectively only 1:19. Why this is so, I will explain later exactly. Let's first look at the forex market.
Interbank Market
The interbank market is the market where money and credit business takes place only between banks. Banks and financial institutions trade with one another in the interbank market, lend each other money and can thus ensure that they remain liquid. Securities, money, foreign exchange, precious metals or derivatives are exchanged in the interbank market. The interbank market is assigned to the money market. The rates of currencies are not determined by a government as long as they are freely tradeable and not linked to another currency. They are based solely on supply and demand. Forex trading is usually OTC, i. E. it is not centrally organized, but takes place directly between the market participants or through a broker.
Bank risks are to be spread across the interbank market. Through it, the banks can carry out liquidation of open positions that were previously established in the customer business. Or the banks operate proprietary trading on the interbank market. In addition, interbank trading should ensure sufficient liquidity at all times for the banks.
The biggest "players" in the forex market are governments and the central banks, which generally participate in foreign exchange trading in the interests of the government. Due to their financial capabilities, central banks are able to exert a noticeable influence on the foreign exchange market. In principle, however, they use currency trading only to adjust and hedge their foreign reserves. The next largest participants are banks and other credit institutions. The proportion of private speculators is very low here in comparison.
EBS (Electronic Broking Services) is the world's largest trading platform for foreign exchange in interbank trading. The price, which arises at EBS, is the reference for any FX derivatives. EBS Markets maintains an anonymized central limit order book. FX trading banks can trade on the market and trade via these hedge funds & CTAs (Prime Brokerage Arrangements). Although the data is collected anonymously, EBS Markets recognizes whether it is a human or an algorithmic interface (AI). In addition to the classification, the EBS regulations provide for a minimum quota life (MQL). This is to prevent the high-frequency traders from the fact that they have only by their speed advantage over the other market participants. In addition, since there is no specific trade information in the interbank market, this market for high-frequency trading is not quite as interesting as the stock market environment.
The big players therefore have sophisticated computer systems to detect inconsistencies in the currency pairs. These inconsistencies usually last only a few seconds. With so many market participants and the large volume of daily sales, it is more important to keep an eye on the trend and the flow of capital than to recognize an undervalued currency. The cash market is the so-called Leitwolf, it is based on all markets. When the EURUSD course is mentioned on television, it is always about the cash market.
Attached Image (click to enlarge)
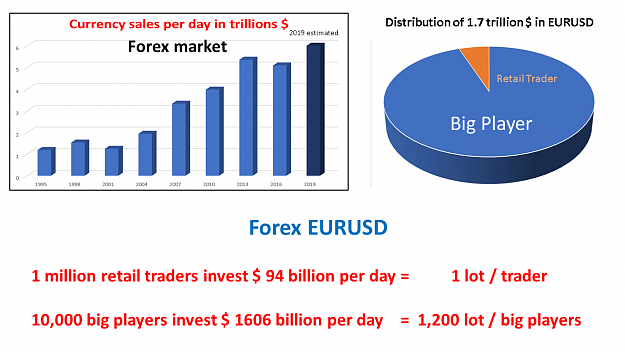
Over $ 5 trillion is being transacted daily in the forex market. By the end of 2019, the $ 6 trillion limit is to be reached. This would have increased the volume of 1995 almost sixfold. In 24 years, the Forex market has thus achieved an average increase of 7% per year.
The EURUSD trades around $ 1.7 trillion per day and the retail trader share is around 5.5% = around $ 94 billion. Worldwide there are about 5 million traders and about 50,000 institutional traders. If 1 million traders per day trade the EURUSD, the average turnover would be 1 lot. Assuming that 10,000 global institutional traders per day trade in EURUSD, their average turnover would be around 1200 per day. This quickly reveals the unequal distribution of powers. The big players act and the retail traders react.
The interbank market has repeatedly come into disrepute, as banks had made price agreements with each other, which had a negative impact on other market participants. In addition, foreign exchange trading almost led to fraud: 98 percent of transactions are conducted in direct trading between banks rather than via a stock exchange. There is no regulatory authority. Only twelve banks control 85 percent of the market. Banks do not trust each other and no one provides information about their trading activities. Therefore there is no real volume or an order book in the interbank market. The resulting volumes in MT4 are a pure estimate.
That's exactly the difference between the two markets. On the stock exchange all market participants have the same extensive information. In Forex market, most market participants have insufficient information. With a trading volume of over 21% in the interbank market, Deutsche Bank has so much experience that analysts and programmers are able to develop interesting strategies from the existing data. This brings clear advantages in the trade. With an average daily sales volume of 3,600,000 plumb bobs, they simply have more background information than the small retail trader. In addition, the Big Boys spend billions on their analysts and traders. A truly successful trader earns millions of dollars a year in these financial firms, after all, he should not have to worry about financing his house, his cars and vacations. He should be free in his mind and concentrate 100% daily on the market.
It scared me that some banks are investing 20-30% of their available funds in the forex market and with that gaining up to 65% of their yearly total profits. So, if you make a bank transfer again and it takes 2 days to land on the other account, it could well be that, among other things, this money is being used in the EURUSD to fund a breakout that may even stop you.
MT4 is the world's most popular forex trading platform. His next competitor is the MT5, which, as the name suggests, is also built by MetaTrader. It is conceivable that even some larger traders will work with this platform in the forex market.
Nevertheless, the forex market is more opaque to the retail trader than the exchange-regulated market.
Futures
The buyer of a futures contract undertakes to buy the underlying asset on the due date at the agreed price. The seller of a futures contract, however, to sell the underlying asset on the due date at the agreed price. At first glance, futures trading thus does not differ from ordinary cash markets, such as the stock market.
But there is one major difference: futures are related to an Underlying, and their Derivative Market price-depends mostly on the spot rate. The price of the Euro FX Future is always slightly above the spot rate of the EURUSD. There is a simple reason for this: if an investor buys the EURUSD on the cash market, he must pay the entire purchase price immediately. On the other hand, if he opens a long position in the Euro FX Future, he only has to deposit a fraction of the current market value as collateral for the futures exchange.
The difference between this margin and the full market price may be invested at a safe interest rate. The returns to be achieved with this safe interest rate correspond to the price difference between the spot rate and the forward rate. Investors can basically trade two different motivations futures. Firstly, futures trading is suitable for speculative purposes because capital investment is low, liquidity is high, and the range of tradable markets is ready. Second, futures are suitable for hedging economic or financial risks. A farmer can sell the late summer corn crop at a fixed price as early as spring, and a portfolio manager can hedge a stock portfolio against general market risk.
Futures trading also offers several benefits to private investors. First, almost no other financial instrument makes it so easy to speculate on falling prices. For this purpose, only a short position must be opened in futures trading, while short sales in equities are only relatively cumbersome. Futures offer much simpler pricing than options, where residual maturity and volatility sometimes influence the option price more than the actual performance of the underlying.
Second, unlike certificates and contracts for difference, investors can be confident in trading futures on a futures exchange of regulated and closely supervised settlement. The business model of many brokers and issuers is precisely to pass on the bid / ask spreads of the futures market at a premium to their own customers. Third, futures trading requires very little capital investment compared to a direct investment in the underlying asset. This allows trading to leverage: Investors can move many times their assets in the market and thereby generate disproportionate returns relative to their use.
The Chicago Mercantile Exchange (CME) announced in early January of this year that it would reduce the tick size for the futures contract to EUR / USD from one pip ($ 12.50 per contract) to ½ pip ($ 6.25 per contract). With this measure, the CME makes the Euro FX future even more interesting, especially for day traders and scalpers.
Futures Trading has a large selection. The exchanges offer forward contracts on stock indices, individual stocks, bond indices, volatility, exchange-traded index funds, interest rates, commodities, exchange rates and even real estate prices. Even if the individual contract specifications differ, the actual trade always runs the same way.
Who sets on rising prices in, opens a long position. If investors expect falling prices, a short position will be opened. In this case, it is an opening position. Even though futures are unconditional forward transactions with a concomitant obligation to buy or sell, it is very easy to exit the market. Investors open a closing position. A short position is closed by opening a long position with the same number of contracts. The market risk is completely eliminated and the investor acts as if he had not previously opened a position.
The performance of the futures depends exclusively on the performance of the underlying, the margin on the futures exchange, the market interest rate and the remaining term of the contract. As a rule, the price of the futures is only a few points above that of the cash market. In the FX Future, the minimum bet is 1 lot ($ 125,000), a tick is 0.5 pip and thus the volatility is slightly lower than in the Forex market. Depending on the broker, leverage is possible up to 200. The minimum deposit is $ 5,000 for most brokers and there are also brokers who charge significantly less. However, this is not recommended, because a futures account under $ 20,000 makes no sense to me.
Attached Image (click to enlarge)
More than $ 800 billion is being transacted every day on the world's top 10 exchanges. By the end of 2021, the $ 1 trillion limit could be reached. The forex market is 12x larger than the futures market and 27x larger than the stock market. Since only professional traders trade in the futures market, there is no such thing as the typical retail trader. Of course, there are big players, and especially the dreaded high frequency traders, who are quite different from the smaller traders.
In the regulated stock market, price fixing which had a negative impact on other market participants is more difficult. There is a real volume and an order book in the futures market. All market participants have the same information. The key is the interpretation of this information.
The MT4 does not work on the Future markets, however, the MT5 can be used here, which is too confusing for me, however. A Ninja Trader already has clear advantages but is not as clear as the platform ATAS, which, however, costs a one time $ 2,500. What matters is what information you need for your trading strategy.
Before we start with a comparison between the forex market and the futures market, we first look at how difficult it is to survive in the different markets.
Which markets are particularly hard to trade?
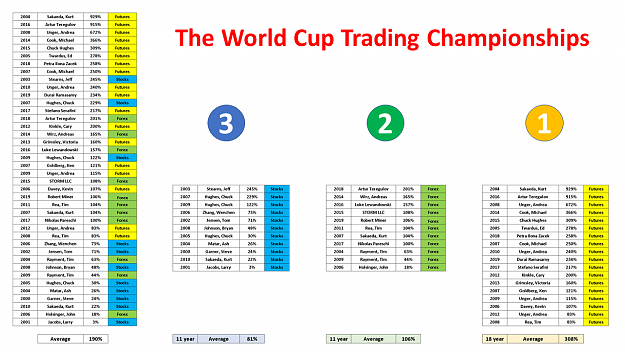
Since 1984, the World Cup Trading Championships (WCTC) holds a Trader World Championship every year. There are different categories whereby I would like to compare only 3 categories stocks, Forex, and Future. The rules are simple. All participants who want to participate in the same broker open a trading account with $ 10,000 in the future or $ 5000 in the forex. Traded only with real money over a period of one year. Every trader can individually trade from home within this year. There must be at least ten round-turn trades. At the end of the period, the three winners with the highest net return are determined. Some traders trade at very high risk, and some drawdowns are above average speculative. However, everyone in this contest has the same opportunities to compare each category. The returns are not representative but provide a rough guide as all participants have the same requirements.
Attached Image (click to enlarge)
On the right side you will see a table where the respective World Champions are listed in each category. The period is between the years 2000-2019, with the figures from 2019 being an intermediate, as the competition will run until the end of this year. The average return across all categories is 190% per year. That such a return can only be achieved with an increased risk in the trade, everyone should be clear.
Although we only need the forex and futures markets for our comparison, I included the stock market for additional comparison. Incidentally, I have used all the figures that have been provided to me.
Equities
In terms of equities, an average performance of 81% per annum was achieved within eleven years
Forex
Forex has achieved an average performance of 106% per annum over eleven years
Future
In the area of futures, an average performance of 308% per year was achieved within 18 years
Conclusion and knowledge
In my opinion, the stock market is one of the most difficult markets you can trade on the stock exchange, because a lot of background information is needed for a good performance. In addition, you have to be able to interpret a trade balance correctly and read between the lines. A return of over 81% is an absolute top performance in this market segment.
Let us now compare the forex market with the futures market. Basically, it is striking that the yield in the futures market is almost three times higher than in the Forex market. The best return in the forex market does not even match the average yield of the futures market. The 5 worst returns in the futures market correspond to the average yield in the forex market.
The fact is that the yield in the futures market is three times higher than the yield in the forex market. However, it should be noted that in the forex market trades very many beginners, while the future market is used almost exclusively by professionals and experienced traders. Many traders who started in the forex market trade now in the futures market.
Since the forex market is the interbank market, where banks trade with each othernot in a regulated market, it should be clear that the challenge in trading there is significantly higher than in the futures market. Based on the numbers, it can be assumed that trading in the stock market is almost 4 times and in the forex market is three times as heavy as in the futures market. This is basically an important insight, if you are in one of these markets.
Many believe in the beginning of their trading career that the chance of winning is 50%, as the price may only rise or fall. But that is a mistake. 95% of retail traders lose their money over a long period of time in the forex market. The profit probability of retail traders is thus 1:19. Take 19 cards, place them on the table and pick a specific card. Now close your eyes, shuffle the cards and draw a card from the stack. If it is the previously chosen card, you have won.
The losses are so inevitable and no one should be sad if he loses, that's completely normal. The only chance is to get closer to the market every day through personal experience. This only works if you limit the losses severely and act more defensively than aggressively. As a rule, one lets losses run too long, because one hopes that the market comes back again. Profits are taken too fast because you do not want to give back your win. And then there are the revenge trades to recover his losses. These are typical human habits that you should quickly forget as a daytrader or swing trader.
If you start as a beginner in the EURUSD Seconds Chart with Scalpen and make your entries and exits dependent on indicators, the loss is a sure thing. If you start with table tennis, the ball at the beginning is also played slowly back and forth to get a feel for it. Over time, you become safer and able to accelerate your game. If, as a beginner, you face the multiple table tennis world champion Ma Long from China you will not win a game.
When trading our opponents are almost exclusively world champions, but since many beginners sit in front of their screens, and the opponents do not see, most believe that you have a real chance. If a beginner could see the professional traders of the banks, the initial losses would probably be much lower. The problems are the many self-proclaimed trainers who have no idea about the trade, who pull the money out of your pockets and let you believe that trading is easy. It recommends strategies that could be downloaded for free from the internet. Add to that the many trading books that are recommended on the internet and are actually worth a penny. I was fortunate to not read any of these books at the beginning. When, after a few years, with some experience, I took these books in hand, I was glad that I could not orient myself to it.
The forex market is three times heavier than the futures market, it is crazy that a beginner starts in the heaviest market and when he has success, to move into the lighter market. Normally it should be the other way around.
Comparison Forex Market / Future Market
In the following comparison, the EURUSD in Forex is compared to the Euro FX E6 Future. As I already wrote, these are two completely different markets, which also differ in pricing. Nevertheless, the futures market is based on the cash market, which means that the markets are indirectly linked.
Attached Image (click to enlarge)
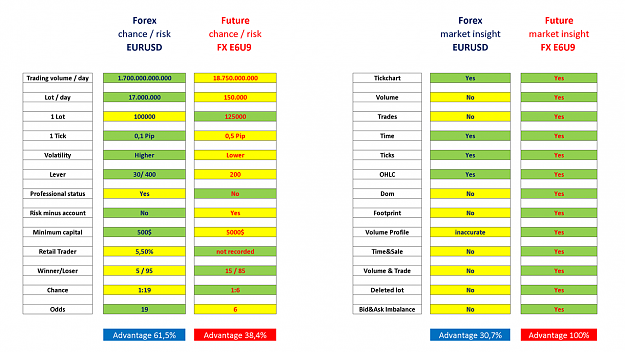
As we already know, $ 1700 billion is being converted into EURUSD Forex per day. At a Lot value of $ 100,000, this equates to an average daily turnover of 17 million lot. In the futures market, 1 lot equals $ 125,000 in sales. From the stock market data of the CME we can see that on average 150,000 lot are traded per day in Euro FX. That's equivalent to $ 18.75 billion in revenue. The Euro FX Future is 90 times smaller than the EURUSD Forex.
Volatility is significantly higher in the forex market at 0.1 tick than in the futures market at 0.5 tick. In the forex market, the leverage for a non-professional trader is 30, while the lever in the futures market can be up to 200. Both accounts can be opened by beginners, whereby the advantage in the Forex market is that a trader maximally can lose his deposit. With his Trader account he does not run into the minus. In Europe, it is much harder to gain a professional trader status in the Forex area than in the futures market. Only about 4% of all forex traders in Europe achieve these special conditions.
Let's come to a key point: the profit and loss ratio. The probability to win in the forex market is 1:19, as 95% of retail traders lose permanently. Assuming that it is three times easier to make profits in the futures market, there would be around 85 losers for 15 winners. The odd is 1: 6. This ratio could potentially be very realistic, as the futures market is almost exclusively made up of experienced traders.
An interim conclusion:
Looking first at the two different markets, we find that we are gaining 61.5% in the forex market, while the futures market is up 38.4%. This is primarily because the entry criteria in the forex market are easier and the security is much higher.
The fact that one achieves three times higher profits in Future market than in the Forex market, lies essentially in the fact that one gets more concrete market data available in the Future market. First let's look at the market data, which disadvantages there are in the Forex market.
In the forex market, we do not receive a specific volume (number of lots) or a specific number of completed trades. Therefore, there can be no Dom and no Time & Sales list. It is also impossible to display a footprint chart, a volume profile, deleted lots in the dome or an imbalance in bid and ask. For this, the largest banks would have to be willing to publish their data. And that is exactly what will never happen in the forex market. Due to poor data information, the forex market comes to an advantage of 30.7% while the futures market comes to an advantage of 100%. This makes it clear that the futures market has over three times more information than the forex market.
If you add all the advantages together, the forex market would come to 90% while the futures market gets just under 140%. We realize there is no clear market that only has benefits. But a smart trader tries to optimize the benefits and minimize the disadvantages. First, let's see if such a strategy is even possible.
Attached Image (click to enlarge)
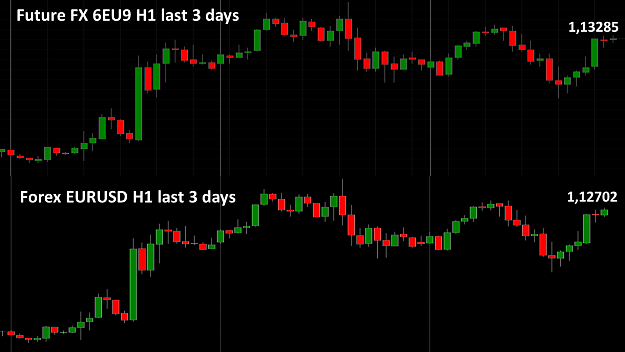
As we know, there are different prices in the EURUSD Future and Forex market. In the picture above we see the Future FX market in H1 and in the lower picture the EURUSD H1 in the forex market. If you compare the candles, you will find that the differences are marginal. And yet the prices are different. This realization is very important to make a further decision.
I compared the data feed of the futures with the data feed of the Forex market over several months and found that the data feed of the futures had significantly more problems. But that could been coincidence. I myself have a very fast data feed in the forex market, which runs very stable even with strong volatility.
The cost of a lot for me are significantly cheaper than in the futures market. On the Forex market I pay average $ 4- $ 4.5 per roundturn per lot, between $ 5 and $ 10 in the futures market. With 200 trades per month, that's a big difference.
The chance to win in the forex market is 1:19, while the chance in the futures market is 1: 6. Consider, for a brief moment, the opportunities that result. A winning chance of 1:19 means that the trader wins, what the other 19 traders loose. In the Future Market, the winner receives the money from 6 traders who have lost.
We must note that in the Forex market 90 times more money is converted than in the futures market. Let's just do it all down. The forex market is $ 1700 while the futures market is $ 18.75. Thus, it is clear that the profits in the forex market in the ratio are significantly higher than in the futures market. In contrast, of course, there is the much higher risk.
The ESMA regulations made me register a year ago as a professional trader within the Forex market. Since I can never lose more money than I have in my account, in the event of an uncontrolled breakout, my account will not go down. A possible minus account is excluded. That has kept me from trading futures. With the franc shock in the EURCHF, a few years ago, the price went down by 2200 pip within a few seconds and plunged many dealers into misfortune. Anyone who believes that such a thing can not happenmore, is wrong. At the beginning of 2019, some of the prices dropped 700 pips within minutes. So, if someone had just set five lot on a rising course, he would inevitably have been dragged down. In these fast movements, it is questionable when the first buyers come back into the market and the stop finally starts. In the most extreme case, that would have been a minus of $ 35,000. Had the account been $ 15,000, a $ 20,000 back payment would have been due. In my case, I might have lost a maximum of $ 2000. This is a crucial aspect that should not be neglected.
The typical business model of retail brokers is in most cases not suitable that customers make money. It is crucial that one can recognize potential conflicts of interest of the brokers. The danger is that the forex brokers usually know very well where customers are stopping, and that the prices are being pulled up or down around one or the other PIPs to "fetch" those stakes. Compare once in the cash market in EURUSD the highs and lows on major chart brands. If the cash market prices deviate too much from the broker, you should investigate more intensively and possibly change the broker.
Since I have multiple accounts with my broker, I can shift my money within seconds if I want to market with a higher number of lots. In the same way, I can again take my money from the risk area (my current trading account) and transfer it to the second account. In case of a uns in the 1 Tick Chart. Since I trade in the forex market, the specially created Time & Sales list helps me a lot more than thstrong drawdown, the secondary account is not affected. I basically work with virtual orders and stops that my broker can not see. In recent months, the market orders were clearly in the advantage, often I'm so fast in the market and out again that the broker would have no chance to chase me in the stop. Although I believe that the manipulation with an ECN broker is rather not given.
What remains at the end is the chance to win. In the futures market, the probability is three times higher than in the Forex market. We have already analyzed the reasons in detail. The reasons for the higher odds are the much better and more accurate data. Let's first look at the data we can get in the futures market.
Attached Image (click to enlarge)
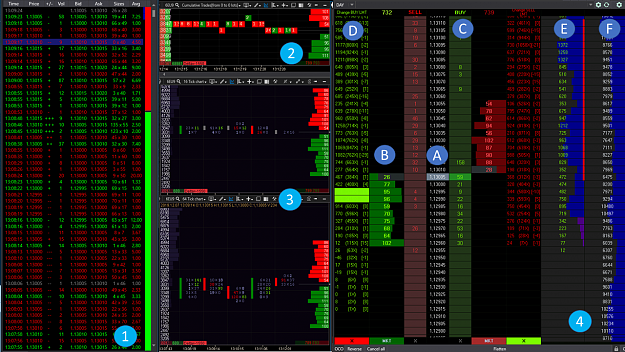
At point 1 we see the Time & Sales list, which is going down relatively quickly in periods of high volatility. In the middle of this list you can see the number of lots traded within one tick. The representation, the displayed Lot is not optimal. For me it is a significant difference if 1 lot or 20 lots were traded in one tick. Accordingly, the Time & Sales list should be adjusted accordingly. For the forex market I have built up a time & sales list, in the form of a graphical representation, which re list from the futures market. I will publish an extra post in the next few days.
Under point 2 you will see a way to view the cumulative trades that were carried out on different price zones. This presentation does not help me personally, but you have many options to change the presentation form. Under point 3 you can see a footprint chart in two different tick charts. This is a very interesting form of presentation for me, which gives me a clear advantage in the trade. Under point 4 we see the DOM. Many Forex market traders believe that this DOM is the holy grail, unfortunately this is a fairy tale. Point A shows the current price in the market and the spread (Level1). Point B shows an inventory of current buy and sell orders. In the context of this list, the entire folders are arranged according to their limitations. (Level2) Unfortunately, this is just a so-called limit order. However, this view is only half true, since the market is essentially determined by market order. The come, however, without notice in the market. Likewise, no stops are displayed in level 2. Point C shows the orders that have moved the price. This information is very interesting and can be found in the footprint chart again.
A big problem is the so-called spoofing. Many traders orient themselves on the Oderbruch to see at which level there is greater buying or selling interest. Often, larger dealers place orders in the market and thus fool a buying interest. Just before the limit order is picked up, it is deleted again. Under point D you can see exactly these deleted orders and immediately find out at what level a spoofing has taken place. Under point E you will find the volume of the current day and under point F the volume of the previous day, but this can be adjusted individually.
Attached Image (click to enlarge)
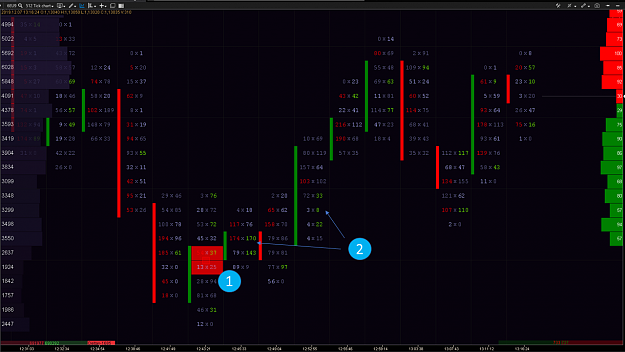
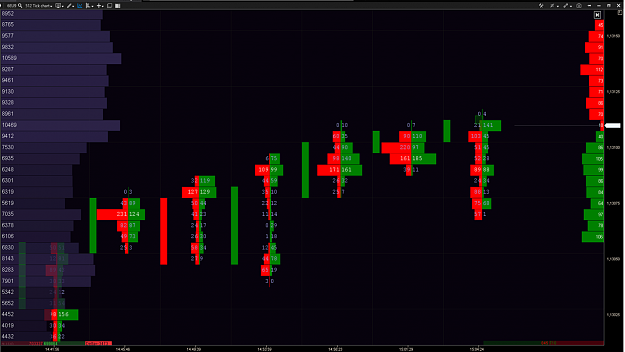
The following overview shows a footprint chart in the 512 tick chart. On the left side you can see the accumulated volume, on the right side the Oderbuch Level 2. The red and green bars represent the respective movement between Open and Close. Unfortunately there is no Bioniccandle in this area, which may change in the future could. Inside a candle you will see two different numbers. The left number represents the settled bearish lot, the right number represents the settled bullish lot at a certain price level. The colored numbers indicate the imbalance in the market. BIDxASK Imbalance is a way to read the volume. It makes it possible to measure the difference of executed market orders on BID and ASK via a percentage filter and thus to see more aggressive market participants. As you can see in the graph, aggressive buyers are shown in green and sellers in the chart in red. Correspondingly, market reactions can occur again at these "aggressive" price levels. The imbalance in a chart, recognized in advance, can help you use relevant prices where there was aggressive pressure from buyers or sellers to time your entries and exits. These key areas show us the intentions of aggressive market participants and we recognize the prices at which the buy or sell activity begins. Resets to the relevant prices show here in the screenshot a clear reaction in favor of a bullish continuation. It is assumed that markets are driven by the positioning of institutional money. This can be seen by studying the large orders / volume. The BIDxASK Imbalance Chart gives us the advantage of not positioning ourselves against the prevailing order flow. Also at point 1 you will find two red colored zones. A very interesting algorithm searches out the strongest movements in the market and marks them. This form of presentation of the footprint chart is interesting in that one can immediately recognize at certain resistance zones whether strong buy or sell orders are absorbed.
Attached Image (click to enlarge)
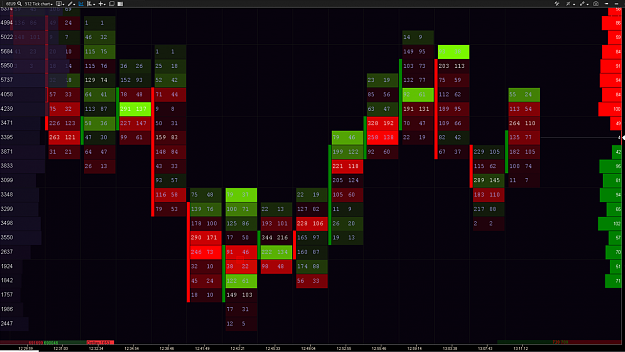
Here we see another illustration in the 512 tick chart. The numbers on the left represent the number of the volume, the numbers on the right represent the number of completed trades. From this one can draw very interesting conclusions.
Attached Image (click to enlarge)
In this form of representation, the volume in a candle is exactly divided within the tick chart. This allows you to see the strength within the candle relatively quickly and to deduce possible conclusions about a future resistance range.
Attached Image (click to enlarge)
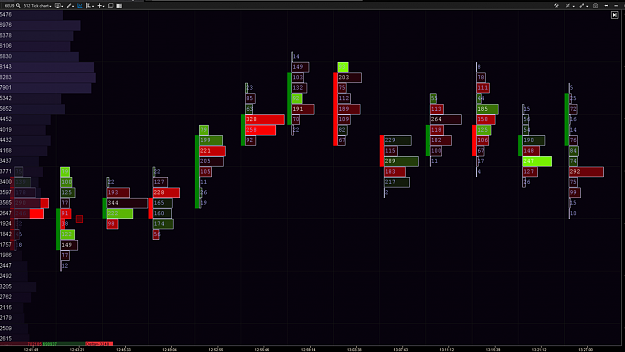
The same presentation as in slide 9, but here the volume was divided into bearish and bullish movements. The candle thickness can be seen even faster in this area.
Basically, I still record my resistance zones in the forex market within a 16-tick chart. As soon as the price reaches my marked resistance zone, I collect the data from the futures market. If I realize that very strong buy orders are coming in, but they do not lead to any price changes, I can assume that a larger player will absorb these buy orders. This approach increases my likelihood of predicting a trend change more reliably. However, it should be noted that I am a scalper only very short in the market and thereby achieve significantly higher profit quotas. It is also very interesting when the futures market often runs three times in a row at the same price, while the forex market ends in different prices. This is because the Future needs 0.5 pip per tick and the Forex 0.1 pip. This gives me much more accurate information in the forex within the price. That's crucial for a scalper.
Neither of the two markets is leading, so it could generate a potential advantage. The only advantage in the futures market is the deeper market insight that can be implemented well in the forex market. However, you only have an advantage if you have already marked your resistance zone within the Forex market. The procedure becomes very interesting, if one acts within a strong upward trend, the countertrend. If you have a particular zone in mind, you will need a medium term and short term confirmation that this particular zone is relevant. I've already shown you a few ways in different blogs to analyze the trend strength within specific time units. It should be noted that the confirmation usually take only a few seconds. If you hesitate too long, the chance is over quickly. Every trader has his own strategy and approach here. However, this additional information from the futures market is not cheap.
When a big player pushes the price up, he buys the euro and at the same time sells the dollar. The problem of big players is often not the entry, but the exit. So he needs enough traders willing to buy him the euro. So he searches the stop zones of retail traders. Right there he finds enough customers and can repel his order within a short time.
A big challenge is the differentiation of different orders in the market. A price is in an uptrend and suddenly there is a turnaround and the price is going down. Now there are three options. Pullback, trend reversal or equilibrium. Either somebody sells his previously purchased euro because he wants to realize the profit, or somebody buys the dollar because he thinks the price falls. In the third case, there is a struggle between buyer and seller within an equilibrium. Of course, there are different ways of acting in each price level, the key is to identify the strongest key player. Unfortunately, most come at the last moment with a quick market order. Although much more information can be obtained with the data in the futures market, this information is also severely limited.
In recent years, more and more coaches have entered the market who have sold the footprint chart and volume profile trading as a Holy Grail. There is no way to predict the market, as this market is purely coincidental. Although there are always the same processes, but also these processes wear off over time. Once many traders can identify certain processes, the big player has to come up with a new strategy. It's always about it. Deceive, camouflage and cash in. Since I act in very short time units, I can often take the fast movements with me. With small stops of 0.5 pip the losses are limited.
In a tick chart the differences between forex and futures are clearly visible, while in forex 5 movements take place, there isonly one movement in the future. I do not want to suggest that you should trade Forex with information from the future market. For my trading style, the information from the futures market seems to be worthwhile, whether this will last, we must wait and see.
Professionals act and anticipate, the retail trainers react and help with their stops the professionals to leaving. Professionals work strategically and follow the money and volatility while retail traders give up as soon as their strategy stops working. All who climb into the boxing ring must know the rules and know that they face a world champion. The unfair is that when the big player hits us, it hurts a lot. If we hit the big player, he probably will not even remember it. That's why we often leave the boxing ring with a black eye.
In principle, changes in exchange rates arise through the supply and demand behavior of the market players. Exchange rate changes have great macroeconomic significance and therefore play an important role in economic policy. Looking at changes in exchange rates over time, it can be concluded how market actors assess the development of an economy. A currency undergoes an appreciation when its price rises in the foreign exchange market; there will be a devaluation if their price on the foreign exchange market falls.
Who knows that and takes care of it, is already a long way ahead.
best regards
Forget:That does not work, amateurs build the ark, pros the Titanic!
1
17
- Joined Sep 2009 | Status: Member | 535 Posts
Hi always interesting thank you. When you say
" It is also very interesting that the futures market often starts the same price range three times, while the forex market comes in different price ranges."
what do you mean ?
" It is also very interesting that the futures market often starts the same price range three times, while the forex market comes in different price ranges."
what do you mean ?
1
1
- Joined Dec 2017 | Status: //houston ǝʍ have a probl | 2,398 Posts | Online Now
DislikedHi always interesting thank you. When you say " It is also very interesting that the futures market often starts the same price range three times, while the forex market comes in different price ranges." what do you mean ?Ignored
Thanks for the tip, I improved it directly.
best regards
Forget:That does not work, amateurs build the ark, pros the Titanic!
1
- | Joined Jul 2016 | Status: Trading | 54 Posts
As usual, your analysis is deep and full of useful information, thank you for this.
Sincerely,
WT
Sincerely,
WT
Nothing fucks you harder than Time
1
acttely, your blog deserves to be a reference for all traders as a science of trading but i can't hold all these information in my mind so i'm gonna choose what i need.... i'm currently focusing in your ATR as you are the developer of this indicator I need some clarifications and information may improve my way of trading.
as you can see in the picture
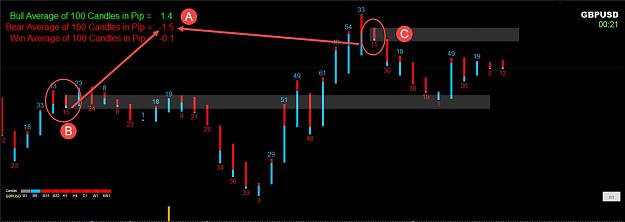
point A Bear Average of 100 Candles in Pip = -1.5
point B we got a Bear candle down with -15 pips and you can see that level makes the price down .... is't that a kind of equilibrium point?
point C again the same principle im sure that's not a coincidence
i got some difficulty to understanding to Benefit from that indicator with right way


as you can see in the picture
Attached Image (click to enlarge)
point A Bear Average of 100 Candles in Pip = -1.5
point B we got a Bear candle down with -15 pips and you can see that level makes the price down .... is't that a kind of equilibrium point?
point C again the same principle im sure that's not a coincidence
i got some difficulty to understanding to Benefit from that indicator with right way
- Joined Dec 2017 | Status: //houston ǝʍ have a probl | 2,398 Posts | Online Now
Project No 6
[quote=thelord14;12385593]acttely, your blog deserves to be a reference for all traders as a science of trading
Hello thelord 14,
First of all thank you for your kind words for this blog, I pass on your compliment to all subsciber who support this blog with ideas and bring forward. As a reference of science, I see this blog less, because science can achieve very little in a purely random market. Each trader has his own view of the market and creates strategies to increase his chances of winning.
The indicator I developed is specifically designed for bionic candles, but differs significantly from a conventional ATR indicator. The ATR is calculated from bullish and bearish movements and not split. The ATR indicator from Wilder includes the closing prices of the previous candles in order to capture potential price gaps. Since I act in relatively small time units, these price gaps are not quite as relevant to me.
The indicator I developed calculates the average pip size of the bioniccandle within a certain period of time. He differentiates between bullish and bearish movements. In principle, this indicator helps to get a rough idea of current market developments. He is not capable of making possible trading decisions out of it.
Many traders try to identify recurring patterns within a price history and derive future trading decisions. In a purely random market, there can be no patterns, since all price movements occur purely by chance and are therefore never the same. The pattern you have discovered is purely coincidental and has nothing to do with the average candle size indicated by the indicator.
It is much more crucial to find out in the course of the market what motives most traders have to act within this market. It is crucial whether you are a swing trader, a day trader or a scalper.
Post 952 How do I optimize my strategy? I once divided different strategies according to their risk factor. Maybe this report will help you further.
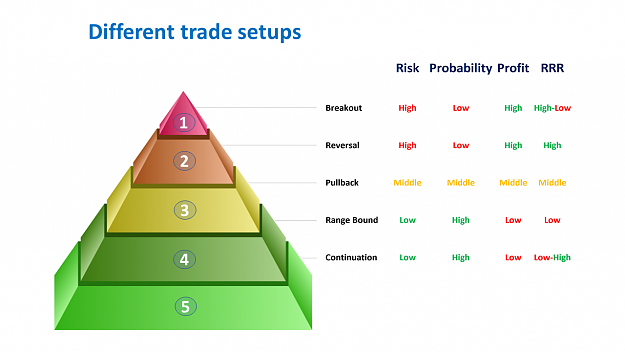
https://www.forexfactory.com/showthr...1#post12357981
If you are looking for patterns, you need to know that at best, possible patterns may look similar but never equal. If they focus their actions solely on the indicator I have developed, they may lose a lot of money. In addition, I use this indicator to calculate a maximum of five candles within a 16 tick chart. The advantage of the indicator is that it also calculates the pullback within a candle. In a 16 tickcharts arise within 1 minute about 4-5 candles. With the indicator I get thus the information what exactly happened in the last M1 candle. Unfortunately, this is not a guarantee what will happen in the next candle.
In the post 967 Forex versus Future, I have presented our new, upcoming project number 6. The information we receive in the forex market is very poor to be able to derive concrete action decisions from it. It's possible, but the odds are 1:19, which means most people lose. With the project number 6 we try to bring the profit probability within the Forex market to 1: 6. Maybe this could be an approach that will bring you on in the long term.
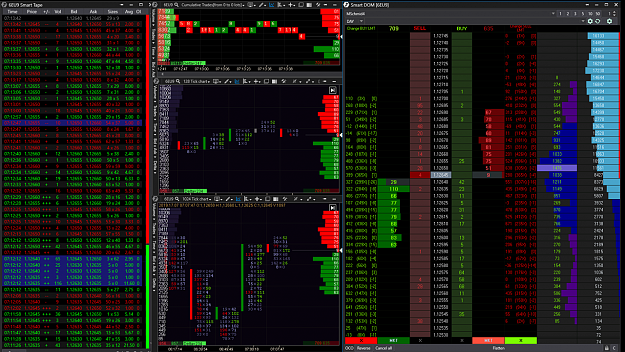
https://www.forexfactory.com/showthr...8#post12383408
The advantage of this blog is that we do not all have to follow the same strategy. Everyone chooses what they like and uses it individually. In my eyes, every trader has to build an individual strategy to be successful otherwise it will not work.
Many years ago I realized that the indicators basically follow the course and are therefore slower than the actual course. Thus, I have cleared all the indicators and focused exclusively on the course. I learned a lot in a few years. I am convinced that with our new project number 6 you will get a lot of information about the background of the market. This may help you to optimize your chances of winning.
I wish you a successful trading day.
Greetings
[quote=thelord14;12385593]acttely, your blog deserves to be a reference for all traders as a science of trading
Hello thelord 14,
First of all thank you for your kind words for this blog, I pass on your compliment to all subsciber who support this blog with ideas and bring forward. As a reference of science, I see this blog less, because science can achieve very little in a purely random market. Each trader has his own view of the market and creates strategies to increase his chances of winning.
The indicator I developed is specifically designed for bionic candles, but differs significantly from a conventional ATR indicator. The ATR is calculated from bullish and bearish movements and not split. The ATR indicator from Wilder includes the closing prices of the previous candles in order to capture potential price gaps. Since I act in relatively small time units, these price gaps are not quite as relevant to me.
The indicator I developed calculates the average pip size of the bioniccandle within a certain period of time. He differentiates between bullish and bearish movements. In principle, this indicator helps to get a rough idea of current market developments. He is not capable of making possible trading decisions out of it.
Many traders try to identify recurring patterns within a price history and derive future trading decisions. In a purely random market, there can be no patterns, since all price movements occur purely by chance and are therefore never the same. The pattern you have discovered is purely coincidental and has nothing to do with the average candle size indicated by the indicator.
It is much more crucial to find out in the course of the market what motives most traders have to act within this market. It is crucial whether you are a swing trader, a day trader or a scalper.
Post 952 How do I optimize my strategy? I once divided different strategies according to their risk factor. Maybe this report will help you further.
Attached Image (click to enlarge)
https://www.forexfactory.com/showthr...1#post12357981
If you are looking for patterns, you need to know that at best, possible patterns may look similar but never equal. If they focus their actions solely on the indicator I have developed, they may lose a lot of money. In addition, I use this indicator to calculate a maximum of five candles within a 16 tick chart. The advantage of the indicator is that it also calculates the pullback within a candle. In a 16 tickcharts arise within 1 minute about 4-5 candles. With the indicator I get thus the information what exactly happened in the last M1 candle. Unfortunately, this is not a guarantee what will happen in the next candle.
In the post 967 Forex versus Future, I have presented our new, upcoming project number 6. The information we receive in the forex market is very poor to be able to derive concrete action decisions from it. It's possible, but the odds are 1:19, which means most people lose. With the project number 6 we try to bring the profit probability within the Forex market to 1: 6. Maybe this could be an approach that will bring you on in the long term.
Attached Image (click to enlarge)
https://www.forexfactory.com/showthr...8#post12383408
The advantage of this blog is that we do not all have to follow the same strategy. Everyone chooses what they like and uses it individually. In my eyes, every trader has to build an individual strategy to be successful otherwise it will not work.
Many years ago I realized that the indicators basically follow the course and are therefore slower than the actual course. Thus, I have cleared all the indicators and focused exclusively on the course. I learned a lot in a few years. I am convinced that with our new project number 6 you will get a lot of information about the background of the market. This may help you to optimize your chances of winning.
I wish you a successful trading day.
Greetings
Forget:That does not work, amateurs build the ark, pros the Titanic!
1
2
- Joined Nov 2015 | Status: Member | 2,525 Posts
DislikedAAA Bionic Power x candle indicator Hello dear traders, {image} On request of a subscriber, I would like to provide you today with a modified strength indicator. The bioniccandle has only one main movement and one pullback inside a candle. The main movement of the bullish candle goes from low to close and the pullback goes from high to close. The main movement is thus the deciding factor. In this indicator, this main movement also receives a special bonus and is thus able to show the strength of a single candle in more detail. If the value is 0...Ignored
Practice makes a person perfect
- Joined Mar 2012 | Status: Trader | 12,127 Posts
Disliked{quote} ....This means that we always find different trends within different time units. ...Ignored
My Threads: Trading is as simple as 1-2-3, Highest Open / Lowest Open Trade
1
1
- Joined Dec 2017 | Status: //houston ǝʍ have a probl | 2,398 Posts | Online Now
Disliked{quote} Price is always the same no matter the time frame. The daily open is the daily open. The daily high is the daily high. The daily low is the daily low. Same for weekly. Same for monthly. Same for hourly. How you slice and sort up the ticks makes no difference, price is always the same. Teaching learned from ADVANCED ALIEN CIVILIZATION TECHNOLOGYIgnored
I totally agree with you that the price history is the same in all time periods, I never wanted to say anything else and believe that this is the typical cause of a misunderstanding. That may be because I expressed myself wrong in a foreign language. This allows the reader to interpret my words differently.
There are different trend phases for me in different time units, although the price course is always the same. A scalper works with smaller stops than a daytrader or swing trader. Thus a trader, in his time unit in which he trades, must observe the trend so as not to be stopped early. And that's exactly what I wanted to express with the example above.
I hope that I could correct my unclear idiom and thank you for bringing this to my attention.
It would be nice if we all perceive the world in the same way. But we do not. In the book What? "Did you really say what I think I heard?" Sharon Morgen explains that our brains delete data, misinterpret, depending on filter tendencies, triggers, assumptions, beliefs, habits and mental models.
In the future I will pay attention to express myself clearly, that there can be no misinterpretations. Unfortunately this is not always easy in a foreign language and because of a different world view of different people, so I ask for leniency.
best regards
Forget:That does not work, amateurs build the ark, pros the Titanic!
2
- Joined Dec 2017 | Status: //houston ǝʍ have a probl | 2,398 Posts | Online Now
Disliked{quote} Chicago Mercantile Exchange (CME) now allows MT5 to trade and a few brokers/clearers are offering MT5 platform for trading of fx futures. Will you be converting this useful indicator in MT5 which can react with real volume of futures?Ignored
First of all thank you for your contribution and your great idea. The AAA Bionic Power x candle indicator is designed to get the most out of the little data we get from the Forex market. We can try your suggestion in the current Project No. 6, but I do not think that this indicator will bring a greater advantage in the futures market than already existing indicators or platforms. The AAA Bionic Power x candle indicator is intended to measure the actual candle strength in the forex market, in the Furure market there is professional software that can even look into the candle.
Attached Image (click to enlarge)
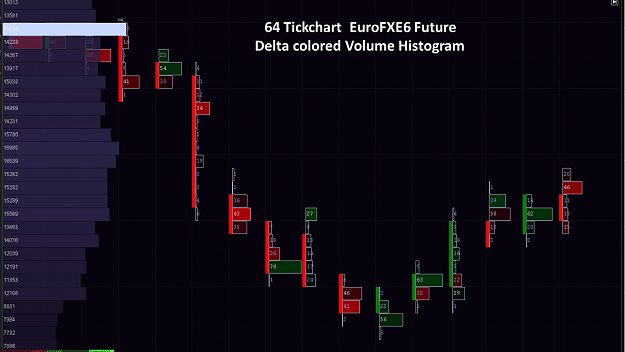
Here you can see a 64 tick chart from yesterday's EuroFX E6 12: 29-12: 30 CET. At first the course went down without much resistance. The Delta colored Volume Histogram shows exactly where the strongest force has been used.
Attached Image (click to enlarge)
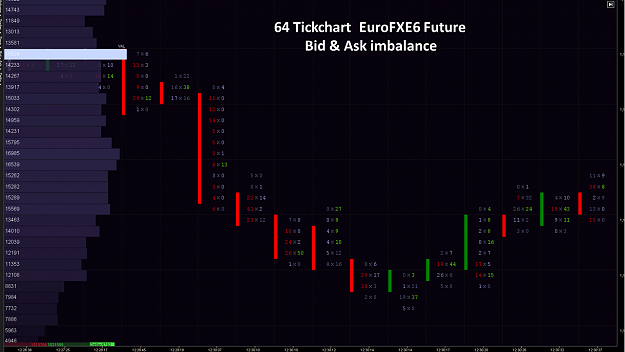
Bid & Ask Imbalance is a way to read the volume. It makes it possible to measure the difference of executed market orders on BID and ASK via a percentage filter and thus to see more aggressive market participants. This makes it easy to find buying or selling pressure and not to position ourselves against the prevailing order flow.
Attached Image (click to enlarge)
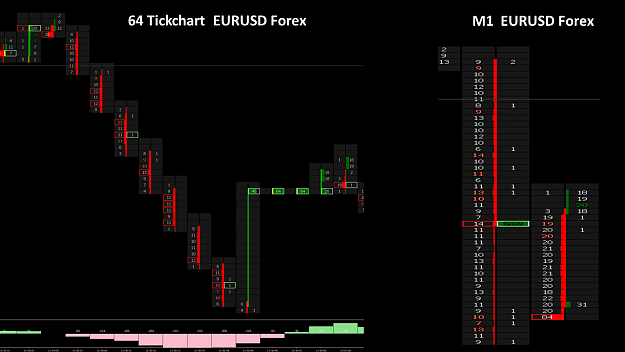
In the 64 tick chart in the forex market, we recognize that unsaved tick data give a completely wrong picture of the market, moreover, we only get insufficient data on the number of market participants and no data on the number of processed lot.
I've been comparing the MT5 with different platforms in the futures market for some time now.
Attached Image (click to enlarge)
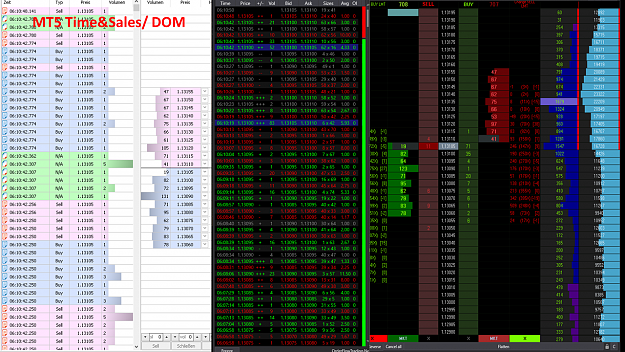
On the left side we see the Time & Sales / DOM in the MT5 on the right side the Time & Sales / DOM from ATAS in the same period. Spoofing (deleted limit order shortly before execution) can only be seen in the ATAS and that is an important factor for me. MarketDelta, JIGSAW, Volfix, Ninja and some other providers are also able to generate Footprintchart, but here everyone has to make their own decisions. The big advantage of the MT5 is that it is free. However, footprint charts cost money again as indicators. With the project 6 we want to concentrate in the next months on the similarities of the Forex / Future market and work out the decisive advantages. The price development in the Forex / Future market is purely coincidental, the only chance we have is to improve our probability of winning. I am curious to what extent we can use the Future data for this.
At the weekend I will post a kind of time & sales list for the MT4 Forex market, this presentation could be very useful for the scalpers.
Thanks again for the good idea.
best regards
Forget:That does not work, amateurs build the ark, pros the Titanic!
4
- Joined Oct 2017 | Status: Member | 11,580 Posts
Disliked{quote}
Let's look at an example in the monthly chart of the EURUSD. From September 2000 to June 2008 we had an uptrend. From June 2018 to January 2017 we had a downtrend. From January 2017 to February 2018, the price has gone up. Since February 2018, the price is in a downward trend. Now comes the exciting question. Is the price progression from point 3 to point 4 the beginning of a new uptrend, or is it just a pullback within the downtrend from point 2 to point 3? Finally we had a short pullback at point 6 and then the course went down. At point...Ignored
Attached Image (click to enlarge)
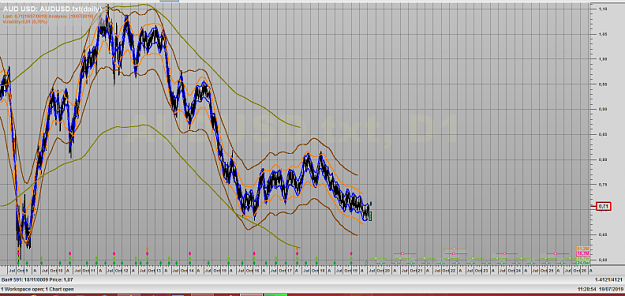
1
- Joined Mar 2012 | Status: Trader | 12,127 Posts
Disliked{quote} Hello TooSlow, I totally agree with you that the price history is the same in all time periods, I never wanted to say anything else and believe that this is the typical cause of a misunderstanding. That may be because I expressed myself wrong in a foreign language. This allows the reader to interpret my words differently. There are different trend phases for me in different time units, although the price course is always the same. A scalper works with smaller stops than a daytrader or swing trader. Thus a trader, in his time unit in which...Ignored
Cheers!
My Threads: Trading is as simple as 1-2-3, Highest Open / Lowest Open Trade
1
- Joined Nov 2015 | Status: Member | 2,525 Posts
Disliked{quote} Hello simnz, First of all thank you for your contribution and your great idea. The AAA Bionic Power x candle indicator is designed to get the most out of the little data we get from the Forex market. We can try your suggestion in the current Project No. 6, but I do not think that this indicator will bring a greater advantage in the futures market than already existing indicators or platforms. The AAA Bionic Power x candle indicator is intended to measure the actual candle strength in the forex market, in the Furure market there is professional...Ignored
You are putting in a lot of efforts in a tough market like fx spot or fx futures.
Scalpers will welcome your research.
I prefer to use an EA to post random trades based on currency strength without guiding the direction and focus mostly on managing risk, hedging locking and unlocking, control drawdown by the use of maximum lots, margin levels%, price bands maximum and minium, and time locks (for timing purpose). All the time sticking to ESMA offered leverage. In my experience, you can't make more than 120% in a year that too not consistently. If you put in same kind of time and effort in buying future options and timing it with breakouts you can make 1000% to 1500% in year by trading a handful of 15 trades in a year.
I will be happy to share my experience with a passionate trader like you.
All the best to you.
If
Practice makes a person perfect
1
- Joined Dec 2017 | Status: //houston ǝʍ have a probl | 2,398 Posts | Online Now
[quote=simnz;12392337]{quote} Hi Bionics, You are putting in a lot of efforts in a tough market like fx spot or fx futures. Scalpers will welcome your research.
Hello simnz,
First of all, I am very pleased that you have found your strategy and home in the trade. We have something in common in this area. I agree that trading in Forex is one of the biggest challenges in addition to equities, but I find trading in the EURUSD a no big challenge as I have been dealing with it for many years.
I have a good friend who has been trading options for years, but that's not my world. Higher returns are a motivating force for many, I've had a steady income for many years, and the trade optimizations I work on every day aim to spend more time with my family and the people I love.
I am also happy if you succeed with EA. EA can contain very interesting algorithms if you program them to filter out the small milliseconds in the Equilibrium to extract information that is not displayed in the DOM or Time & Sales. However, with my experience I would not use it for action.
My passion is this trade and every morning when I get up I am looking forward to working in this market. When I started in this market, I have been modest and with great respect in the trade. In the beginning, I had only my capital, that I had earned over years.I wanted to optimize this capital only with an interesting return, that was the plan. That everything has developed so, I never thought. I do not want to become a multiple millionaire, I take small pieces out of the market and am satisfied. A small cleaner fish that is not eaten by the big sharks, at least not yet.
Thank you very much for your kind offer and I am very honored that you thought of me in doing so. But I hope you understand my intension and my passion for this market, which I have been practicing with dedication for many years.
I wish you this passion from the bottom of my heart and a lot of success besides health.
best regards
Forget:That does not work, amateurs build the ark, pros the Titanic!