quote=alblive;12376196]{quote} not worried. manual stop loss pushed up.[/quote]
@mixedbags, @alblive -- I'm glad your trades are going well. But unless there is something for all of us to learn then I don't want the thread to turn into your personal trade tracker. You can use PM for that.
{quote} quote=alblive;12376196]{quote} not worried. manual stop loss pushed up.
Ignored
@mixedbags, @alblive -- I'm glad your trades are going well. But unless there is something for all of us to learn then I don't want the thread to turn into your personal trade tracker. You can use PM for that.[/quote]
H4 * 6 = D1
Normally 16% ADR should be the correct maths but extending it a lil might work better. So I changed H4 ADR fraction to 20%. This gives us 40% ADR price range for each H4. That’s wide enough and should provide early clues for reversal.
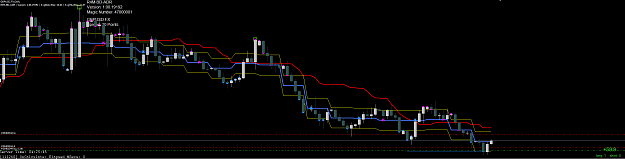
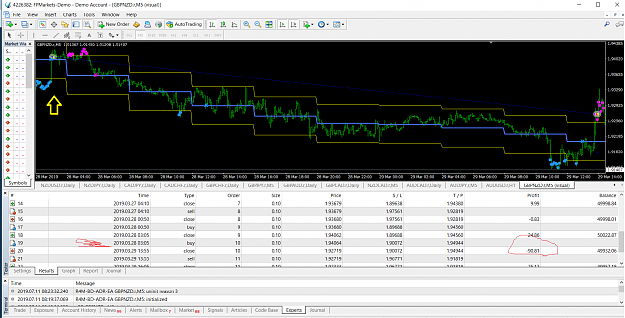
Good job. Exit at the midline. {image} H4 / 20% ADR / 26days H4 * 6 = D1 Normally 16% ADR should be the correct maths but extending it a lil might work better. So I changed H4 ADR fraction to 20%. This gives us 40% ADR price range for each H4. That’s wide enough and should provide early clues for reversal. So; 20% * 6 = 120% ADR [I updated my D1 trading accordingly]
Ignored
Quote
Disliked
Normally 16% ADR should be the correct maths
@bishopdotun -- I don't follow that. Why is that the correct maths? Do you mean that empirically it looks good, or is there something more fundamental going on here.
The reason I ask is this -- I don't think of the ADR as being granular. If the ADR for AUDUSD is 40 Pips that doesn't mean it will have used up 20 Pips half-way through a session. I mean, it doesn't gradually use up its ADR allotment linearly as the day goes along. Rather, at the end of the day the delta between the high and low is around 40 Pips and that could have been reached at anytime during the current session.
I think what you guys are doing at the lower time frames is similar to what @George did when he created 8 TMA levels -- there was no theory involved, only trial-and-error.
I have nothing against empirical -- we should go with whatever works. It's just that it caught my eye when you said "correct math".
EDIT: Also, @skyway was successfully using 240 / 16% at M5, and M5 is not 1/6 of H4.
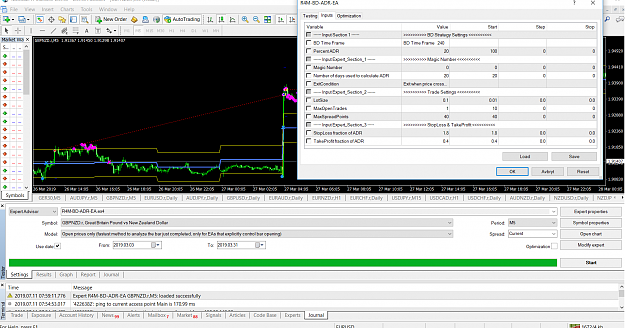
{quote} @El1000 -- below is a screen shot for GBPNZD-M5 that includes the data horizon from around March 26 and March 27 using 240 / 16 as the BD Time Frame and Percent ADR, respectively. Also, I had set MaxOpenTrades to '1'. I'm not sure if all my settings match with yours, but this does look right to me. {image}
Ignored
Hi I have still same problem? hmmm, let me try and download the New EA one moretime.
Edit: Still same problem after downloading the New EA
{quote} I have not looked at this yet but is not 240 meant to be an H4 chart and you are testing it on a M5 TF, should you not set the 240 to 5? Or is the 240 meant to be the look back period?
{quote} @El1000 -- What are you using for the Exit condition -- 'crosses midline' or 'crosses opposite band'? Another thing -- I have the 'Spread' fixed at '2'. Now that I see all your settings, all also try again.
Ignored
Hi,The Exit is "crosses midline" and I have now tested With spread 2, but still same problem
{quote} I have not looked at this yet but is not 240 meant to be an H4 chart and you are testing it on a M5 TF, should you not set the 240 to 5? Or is the 240 meant to be the look back period?
Ignored
@Robot Trader -- that time frame refers to the time frame used to draw the TMA bands -- i.e. if '240' is specified then that means H4 bar data was used to draw the bands. And when you draw H4 bands on an M5 chart they will look very course.
The default is to use 10080 (i.e. W1) on a D1 chart. That's why the bands look like steps -- each one covering 5 days (i.e. 5 D1 bars).
When 240 (H4) is used on an M5 chart then each step will cover 48 M5 bars -- I believe.
Quote
Disliked
Or is the 240 meant to be the look back period?
I wouldn't expend too much mental energy on trying to understand it. I think when people deviate from the original settings then they are taking an empirical approach and using what looks good.
Found another one same problem (same settings)
Edit: I will try to find a pair that I can test in real time, to see if the EA is working live and this is only bug for stratergy tester.
{quote} @Robot Trader -- that time frame refers to the time frame used to draw the TMA bands -- i.e. if '240' is specified then that means H4 bar data was used to draw the bands. And when you draw H4 bands on an M5 chart they will look very course. The default is to use 10080 (i.e. W1) on a D1 chart. That's why the bands look like steps -- each one covering 5 days (i.e. 5 D1 bars). When 240 (H4) is used on an M5 chart then each step will cover 48 M5 bars -- I believe. {quote} I wouldn't expend too much mental energy on trying to understand it. I...
Ignored
Hi R4M,
OK I understand when trading D1 there are 5 days in a trading week, so every step is an average and the horizontal line is equal to 5 trading days.
But when set to 240 what is the horizontal line equal to, because 5 would no longer be relevant on an M5 chart would it?
Some people say I'm lucky, but the more I practice the luckier I get
{quote} Hi R4M, OK I understand when trading D1 there are 5 days in a trading week, so every step is an average and the horizontal like is equal to 5 trading days. But when set to 240 what is the horizontal line equal to, because 5 would no longer be relevant on an M5 chart would it?
Ignored
Hi,This is just a settings for LTF, some of us found out when testing the EA, I think Skyway was the first to post the settings here.We test and then we test again but change one minor part and suddenly you found something that Works ok for intraday trading.
{quote} Hi,This is just a settings for LTF, some of us found out when testing the EA, I think Skyway was the first to post the settings here.We test and then we test again but change one minor part and suddenly you found something that Works ok for intraday trading.
Ignored
Yes I am just trying to understand the logic.
10080/1440 = 7 (7 Days?)
Working it back the other way
5 x 7 = 35 (not 240) so is 240 way too much for a M5 chart
240/5 = 48 (a lot more than a factor of 7)
Some people say I'm lucky, but the more I practice the luckier I get