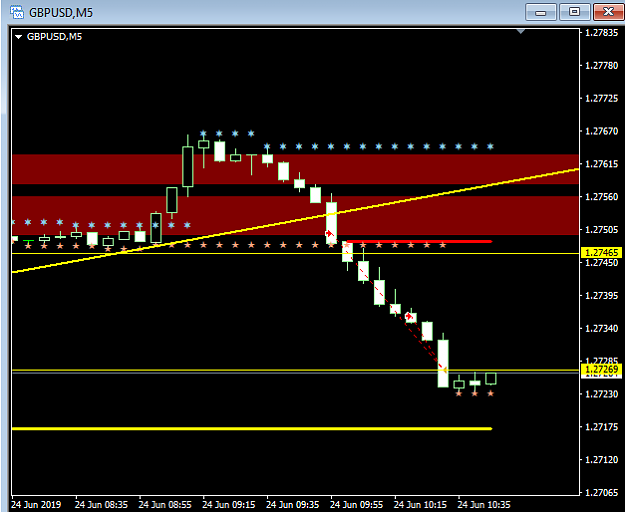
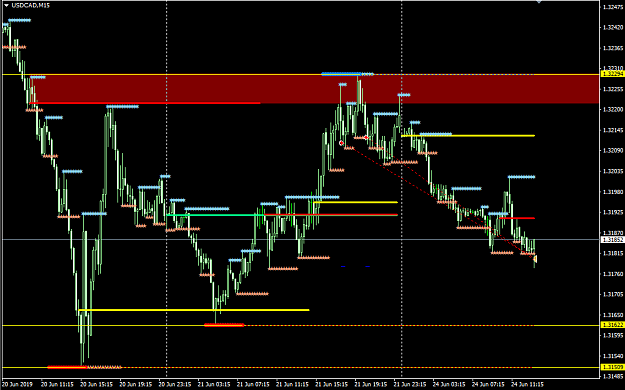
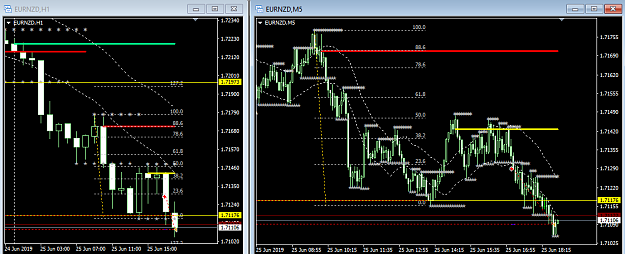
look for something like that or the variations thereof with trading support/resistance and trend line.
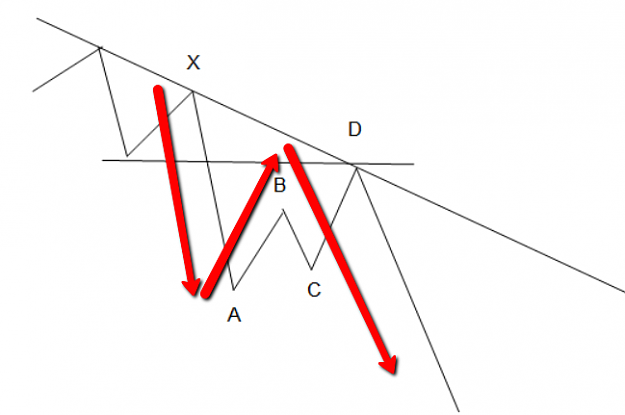
pattern : break - retrace - continuation (BRC).
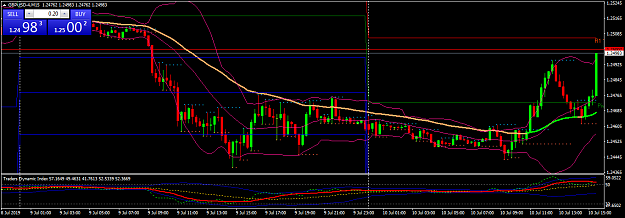
pattern XAB down continuation or XABCD down continuation.
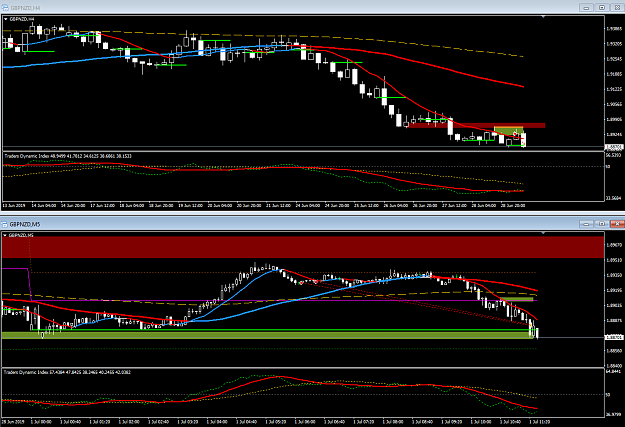
entry at pullback to support turned resistance zone. {image}
Ignored
Inthebox,
I've been using the break out entry method, and use it everyday. When RSI 50 closes below 50 horizontal line, in my experience, I have never seen it break the pattern. except in news.
I want to thank you again for the best indicator ever. I appreciate you, and I think you're a true genius at scalping.
{quote} Inthebox, I've been using the break out entry method, and use it everyday. When RSI 50 closes below 50 horizontal line, in my experience, I have never seen it break the pattern. except in news. I want to thank you again for the best indicator ever. I appreciate you, and I think you're a true genius at scalping. Ron
Ignored
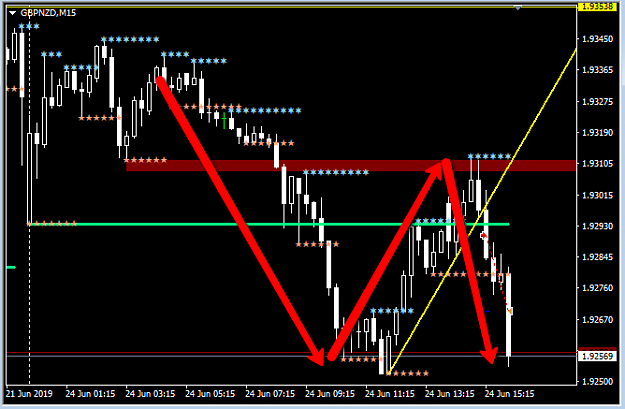
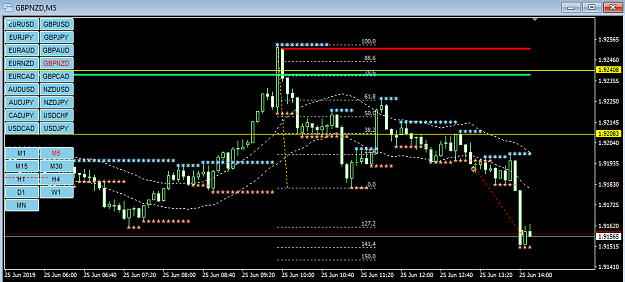
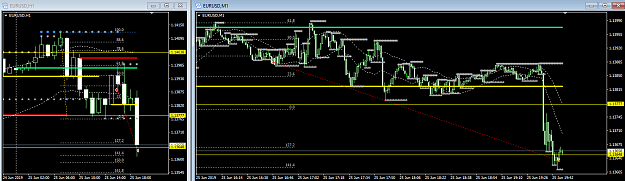
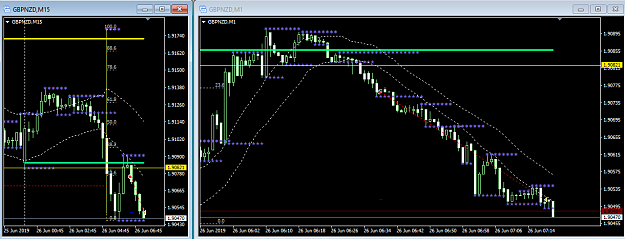
Thanks for your compliment.
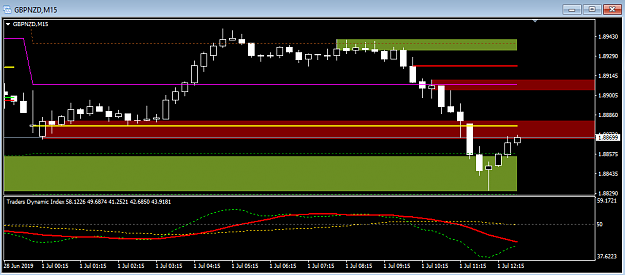
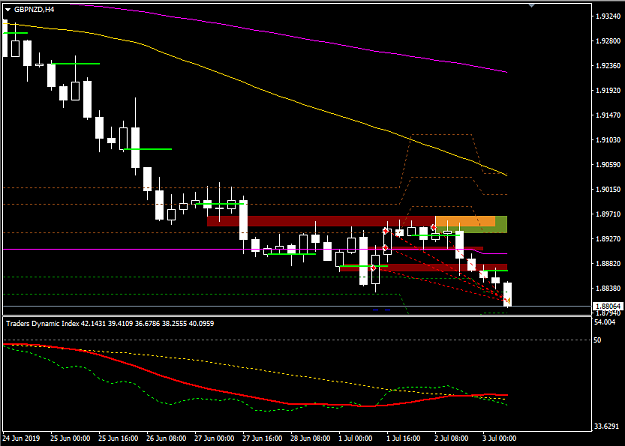
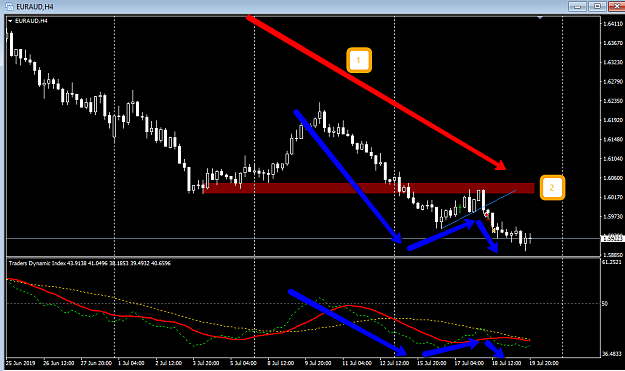
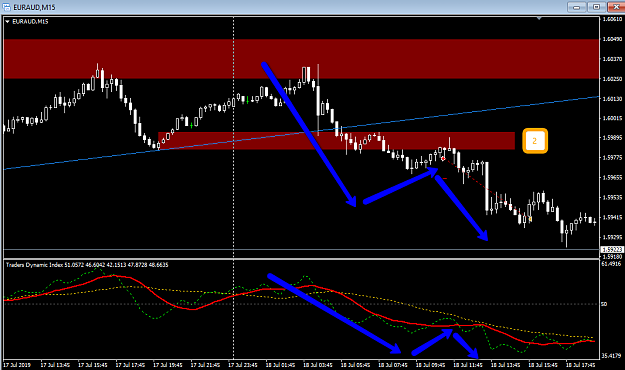
Same pattern can be seen in both price chart and tdi, in higher and lower time frame.
1) Trend - Trade in direction of impulse wave.
2) Zone - Support/Resistance broken.
3) Entry - On pullback to around zone.
{quote} Thanks for your compliment. Same pattern can be seen in both price chart and tdi, in higher and lower time frame. 1) Trend - Trade in direction of impulse wave. 2) Zone - Support/Resistance broken. 3) Entry - On pullback to around zone. {image} {image}
Ignored
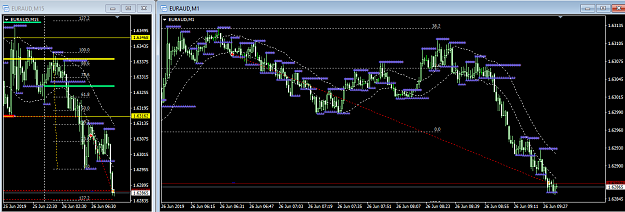
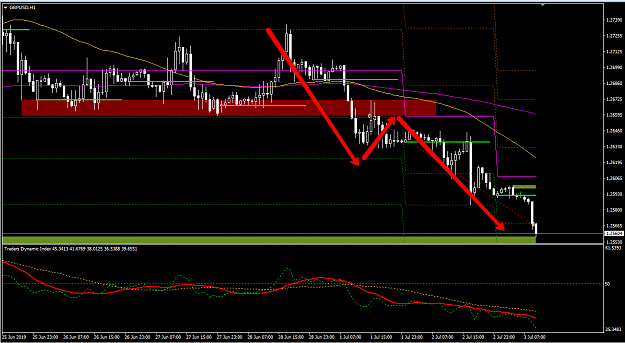
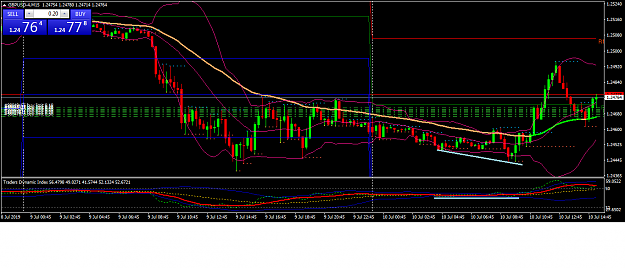
I know you said you don't need other indicators, but it works in conjunction with Bollinger Bands Squeeze. (I don't know about all the time) but when I'm trading, 50/50 detected the trend before the price broke out of the BB Squeeze (range area)
First Image is the before, second image is the after.
The first image shows where this hidden divergence is. (In the lower section of the BB squeeze), but there is no type of divergence on the top area of the BB squeeze. Which most likely means when it breaks the BB Squeeze on the top section, there shouldn't be any reversals in trend. So even before the BB Squeeze break out on the top area, there is more confidence in the up trend. (But I would still rely on the 50/50 rule.)