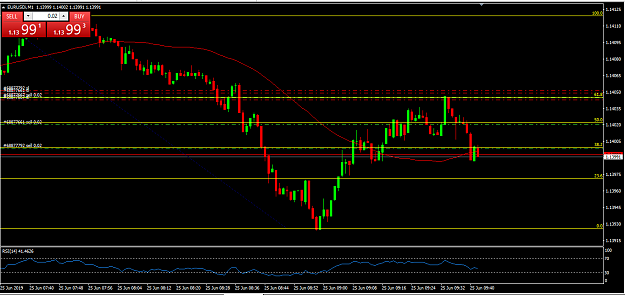
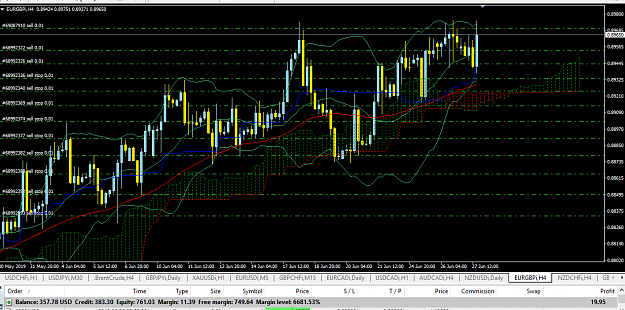
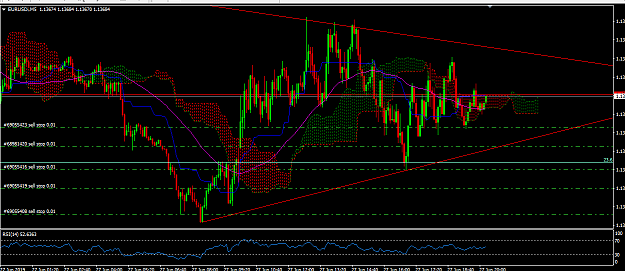
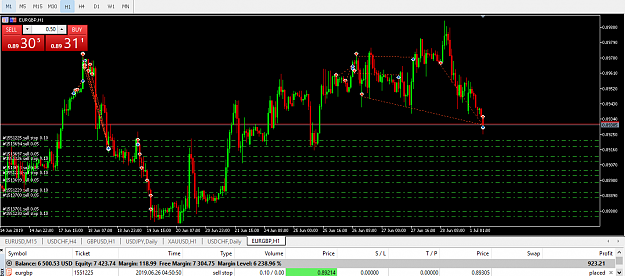
The idea being if momentum stays consistent and price doesn't look back so to speak then this is the ideal pattern. In this case, with such a small spread it is possible to load up a huge position like I did on my demo account when I doubled from 1k to 2k in one move on the EUR/GBP range, which I am still shorting it is at the top of the range again.
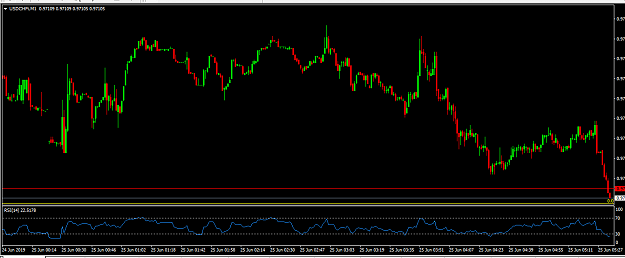
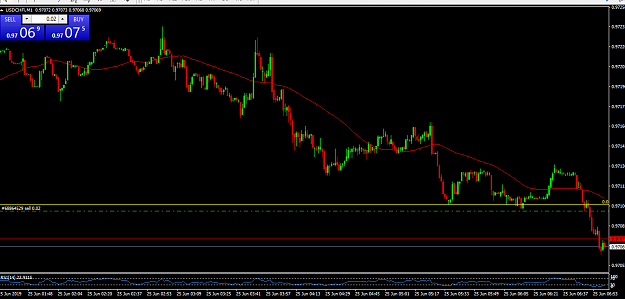
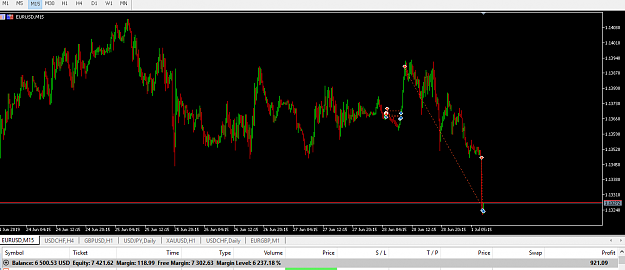
Sure enough, the closing in with the moving average pushed it below support. Now how far can it extend and where to put the stop is the question. It may retest the previous support, I may re-enter there, then move stops to breakeven.
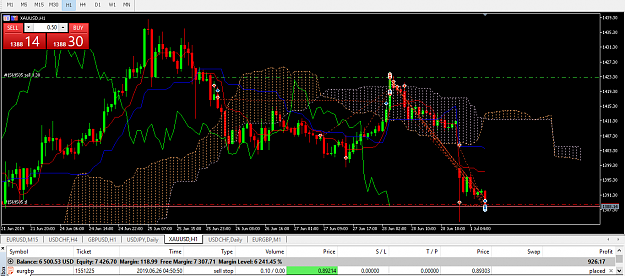
Been scalping it, leaving the top runners just to show off how well fib levels work. They were all the 3 fib levels on the original entry.
I'm learning to trade this pair with this particular amount of leverage. So far I am comfortable with 1/3 of my account size used up as margin. That is about a lot.
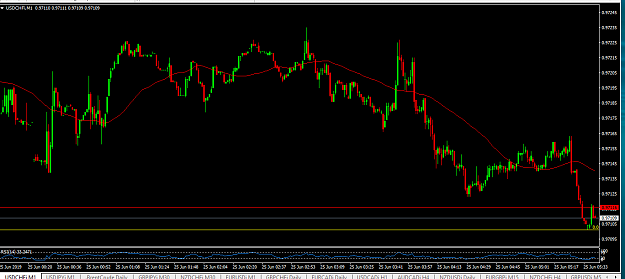
I have little losses so far but hopefully will gain back if the price action goes more south at this trendline. It been tested many times. I may even go long.
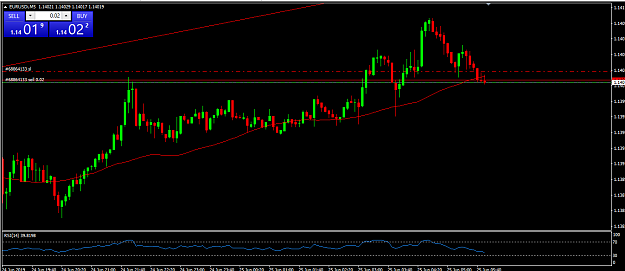
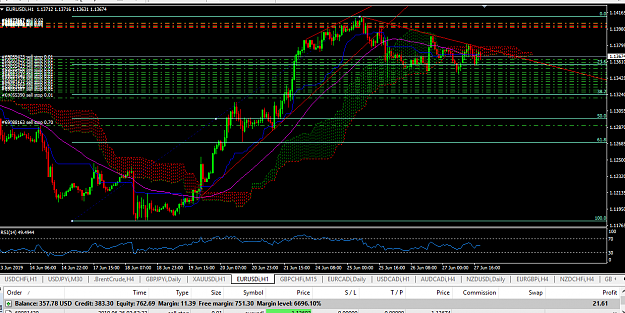
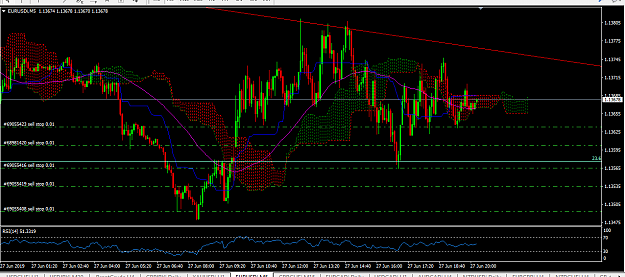
The stacked entries are for when I am not staring at the chart. My handy 0.7 lot position sell stop is below, I just drag it to the price when I want it filled. I enter when
momentum picks up.
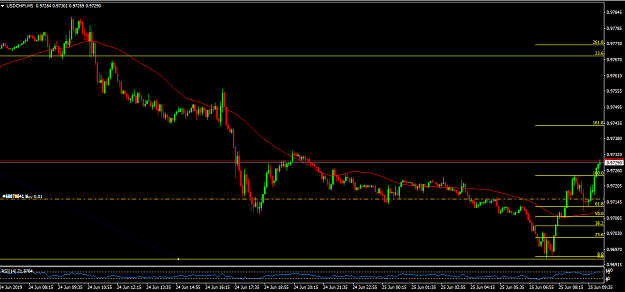
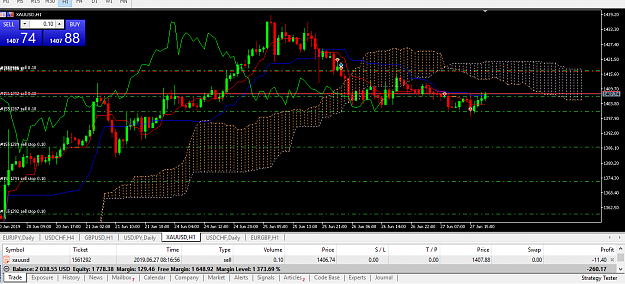
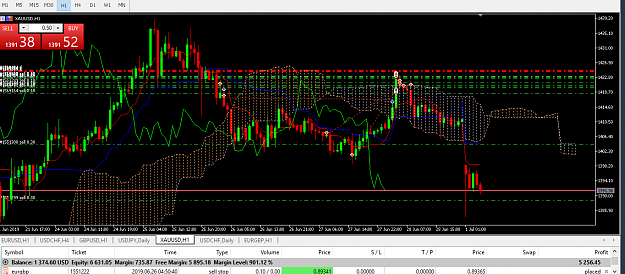
I'm switching up indicators. I don't have as much experience with this Ichimoku but it looks like when used right it can indeed pinpoint trend reversal at least on hourly and above levels.
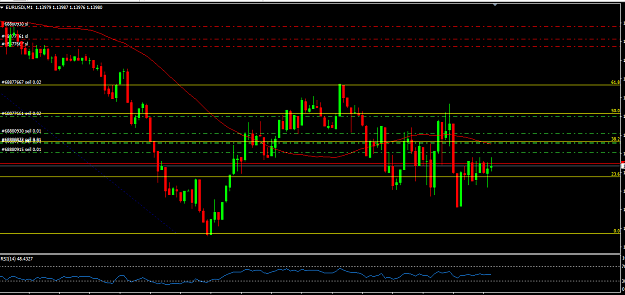
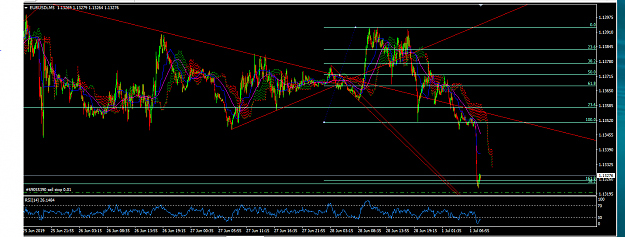
When price reaches the trendline depending on momentum I will try to get in with this larger position and leave it if is spikes down. If it does, then the gains will allow for more margin, so I will add just as large of a position on a pullback, depending on if I should just jump out of the scalp entirely. Thing is, it might make a big move down to at least the 38.2 fib level before a bounce, then the 50 if momentum picks up before it bounces again.
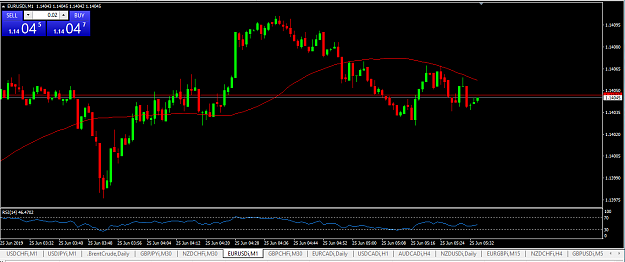
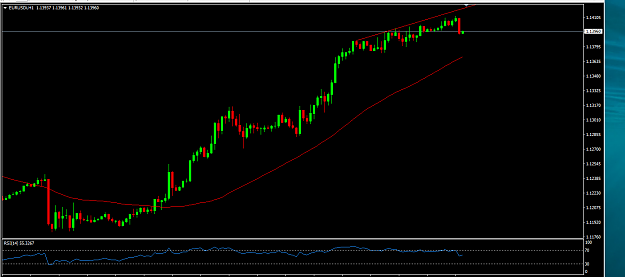
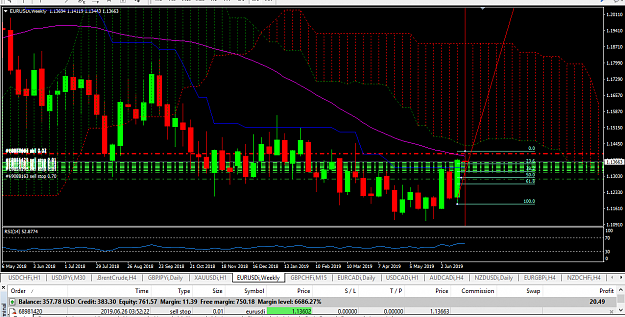
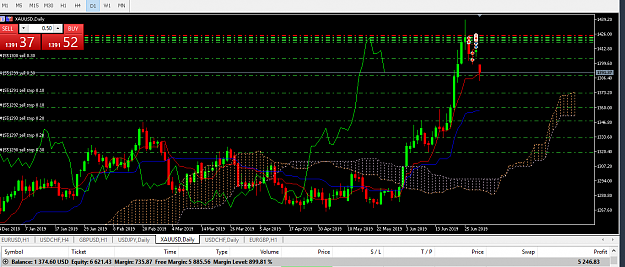
It still looks like a trend reversal to the upside on the larger time frame. Question is when to get in long. How far down until then?
Looking for the result of this week and the open of next weeks candle of it's closeness to the purple sma 50. It may just bounce and continue south, but if it breaks it then long bias.
One idea to contemplate is something I heard on youtube unremembered source but it was that if you can learn what a moving average is and how price always reverts to the average then you can trade. Ichimoku is just several moving averages. I want to study it more. Momentum goes with the average, predicting momentum is key to profitable trades.
This one I am just refining my set and mostly forget (except stop management) method that I am going to code and optimize. No real good setups on the smaller time frames to just small entries.
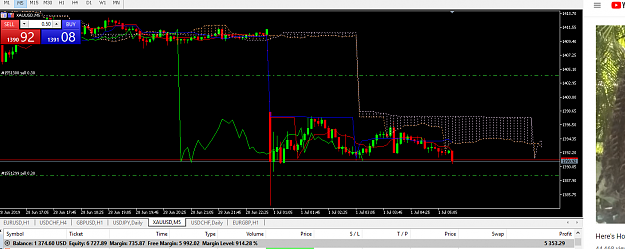
With the nice spread that it's been lately, gold looks good for scalping. It only allows 0.10 position or larger so I am using a demo account to test it. Normally I don't use a demo but I don't like large position sizes unless I am comfortable and know what I am doing. I also would like to observe gold in relation to the major currencies. Oil as well.
Exponential entries is something I am going to experiment with. How to stack entries so they form an exponential curve until profit is taken at a trend reversal sign. The more margin that accumulates, the more entries are taken, or larger entries, stops trailed.
This idea deserves some good backtesting.
The concept of yin building to yang so to speak, since energy does this in other forms perhaps it works in the market.
Just waiting for a spike to hit the trendline. This pair sure spikes a lot, but the spikes stop at chartable sr levels, making it easy to fade them possibly into a major reversal.
Price is cornered. It does this before it spikes, tight ranges or triangles = the market waiting for the time to pass so the chart pattern can align properly. I swear that is what institutional market movers are doing. I want to study how they create the market more and see what they are looking at. They make the patterns work with likley auto entry and exit orders at thereby creating the patterns themselves.
Why can't I make these kind of profits on my real money account? Psychology must be the only reason. I haven't used a demo account much in years but I am starting to now just to see how it affects my skill. I take more aggressive trades but hey they do pay.
What goes up must come down. My what an easy trade.
I can't remember who it was that questioned why I am not super star successful yet after being on this forum so many years. On other reason just as a thought other than gave it a rest a while is that it is quite a difficult market to master. If you disagree here then by all means show your skills! Let me see your trading journal.
I think forex is an essential part of any investors portfolio. It is one of the major markets to trade along with stocks and commodities, options, index funds, notes like hard money, peer to peer lending, real estate cash flow and flipping. It is high risk but not so high so that huge firms don't risk billions predicting it. If it can be mastered it has enough liquidity to easily pyramid into billions literally, like Soros.
What keeps us normal hardworking folk plugging along at it is proof from the geniuses who do master it somehow and make a killing. Easy picking for them. It can be done. I believe in persistence. If inspiration exists, it eventually comes after enough persistence.
Just for documentation purposes where I got in and out of the market. I am taking my winings and am going to practice high risk scalping. Closing some positions on my real accounts too. I have another trader's way account and an oanda. I am going to practice for a while on the demo with large positions and then take small positions on the real account. I need to get used to larger orders. It feels good to cash in large winnings. The market is likely headed the same direction I just will jump back in with large orders when I find a good entry. It is overextended now.
Fib confluence of the 161.8 and the 38.2 larger fib. I am learning more about fractals I will post some you tube videos that I am trying to grasp. I don't quite understand them. There really are many more fib numbers than I am used to working with. I listened to this lecture earlier today. Chaos theory. Chaos is not chaotic, it can be forecasted. Markets are living systems, not artificial. Like the Mississippi river.