Scalper = self-destruction in small installments?
Hello dear subscribers,
To work as an counter-trend scalper with an 8-tick chart would have to be suicide from a financial point of view. But why that is not the case and why I have decided to do it, I would like to show today. After having provided you with some self-made indicators that all have the sole aim of identifying the key candle, I would first like to talk about my skin screen and which auxiliary indicators I currently use in my dashboard.
On my 55 inch monitor are relatively few auxiliary indicators to have a clear view of the candles. Let's take a closer look at the auxiliary indicators, most of which I have already published.
Point A
At the HH, HL, LH and LL you will see numbers. These numbers show the average pipettes per candle in the respective upward or downward trend. From this it is very easy to derive pullbacks and trend strengths.
Point B
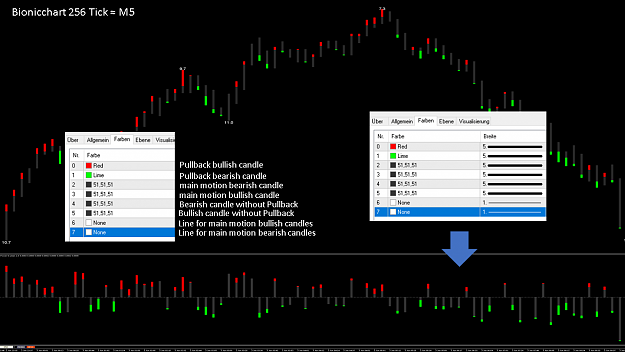
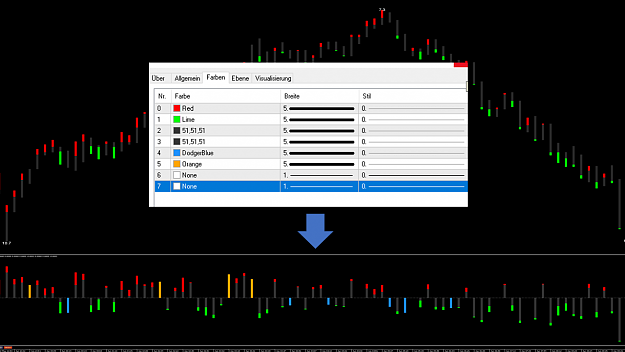
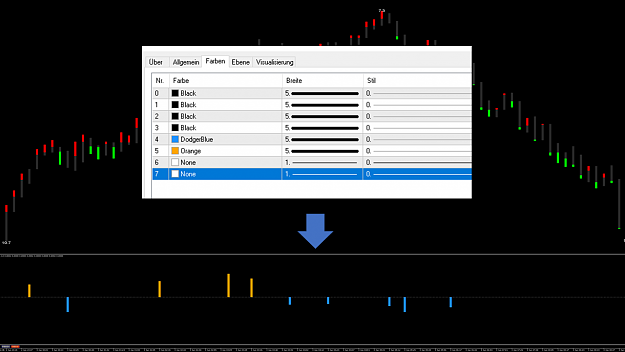
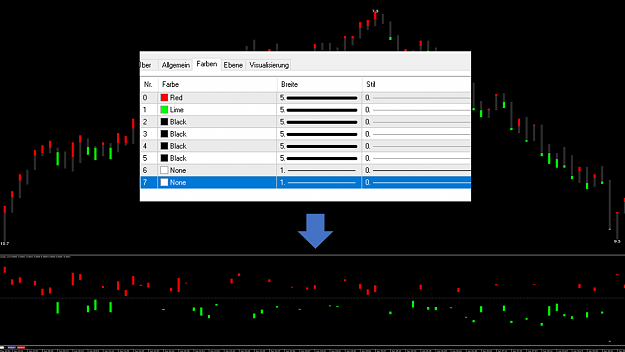
An indicator (blue and yellow candles) that helps me find the tracks of the big players. He is variable and automatically changes the setting depending on the volatility.
Point C
A normal ATR indicator with the setting of the last 100 candles.
Point D
The indicator published yesterday that shows the strength of the last five candles. Especially with trend turning a very interesting tool.
Point E
This is an indicator that shows me exclusively the pullbacks of each movement. As I've already said, the pullbacks within a candle are more important to me than the movement itself.
Point F
A self-developed indicator that shows me the size of the solder used. The displayed strength I have modified with a special calculation formula.
Point G
I create the zones myself using the key candles identified in front of me. From this I deduce my trade. My stops are an average of 0.5 pip including the spread, which is a risk of about 1 pip. I try to realize a chance risk ratio of 1: 5 to 1:10, which is not always possible, because I work in the 8 Tickchart. In addition to my main screen, there are other screens where I watch the course in larger time units. All screens run in the tick chart only the trading screen run in M1.
When I identify my key candles in the 8th Tick Chart, I'm interested in how the price reacts when it comes to these key zones. I created a dashboard for that. Enclosed a short video about the function. At the beginning of the three minutes, the course is initially in equilibrium and then runs down.
Dashboard video
There is a lot of information on this dashboard, which basically only interests me when the course arrives in my key zone. With the indicators I have posted, they are also able to put together such a dashboard. My personal dashboard is an eternal building site, it is regularly updated and improved. If something does not help, it flies out. So I can experiment at least in this area. I chose the Tick Chart because it's the only chance to follow in the footsteps of the big players. In the last few months, I have set 20 different time units in the Tick Chart.
My time units range from the 8 second chart to the two month chart. On average, it generates 64 ticks per minute, and as time does not matter, I never find myself in the same time unit as most traders. If you do not want to lose, you have to act in time units in which the others are not on the way. On average, there are 11,520 candles a day in an 8-tick chart, while in a M1 there are just 1,440 candles. That's 700% more candles in one day. A big advantage: As volatility increases, more candles are formed. Breakouts are excellently broken down into smaller units. From this it is very easy to determine resistance zones.
With a zigzag setting of 8/4/2, I once calculated the movements within a trading day. It is quite clear that within a same time period more movements take place in an 8-tick chart than in an M1. The period shown here in the chart is the same, but the candles in the tick chart are a bit different, although the price spikes are always the same.
The result of May 29, 2019
In the 8th tickchart, 10,600 candles formed a total of 282 zigzag lines, which reached an average of 3.53 pips. In addition, we came in the range of 996 pip within 24 hours. In the M1 Chart, 1440 candles formed a total of 46 zigzag lines, averaging 7.72 pips. In addition, we came in the range to 355 pip within 24 hours.
Analyzing the 24 hours, we see that in an 8-tick chart, about 180% more pip are formed, as over 500% more moves occur in the zigzag lines. However, these zigzag lines reach only 3.53 pip instead of 7.72 pip. That's over 50% less.
Within this 24 hours 282 zigzag lines were created in the 8 Tickchart and in the M1 nearly 46 zigzag lines. In the following calculation, we assume that during the day the trader selects some of these trend trajectories and starts trading.
Since a scalper in the 8-tick chart has six times as many trend courses as in the M1, he also executes six times as many trades in the example. Let's make a comparison between an 8 Tickchart Scalper and an M1 Scalper. We analyzes 48 trades that take place within a certain period of time. Of course, the calculation is purely hypothetical, as a trading transaction depends on many factors.
Example A:
48 trades are executed with a 50% win rate. The spread is 0.5 pip in the case of profit and the total loss in the 8 tick chart is one pip. In M1, the total loss is five pip. I have made these experiences myself in recent years. We assume that both scalpers achieve the average pip size of 3.53 and 7.72, respectively. After a total of 48 trades, the 8 Tickchart Scalper achieved an advantage of 548% over the M1 Scalper.
Example B:
In the following case, the win rate was increased to 75%. The basic calculations are the same. It can be seen very nicely that after 48 trades there is still an advantage of almost 300% for the 8 Tickchart Scalper, but the advantage is reduced by an increase in the win quota.
Example C:
We now reduce the win rate to 25%. While the 8-Tick Scalper is still slightly in profit, the M1 Scalper has already lost more than 15 pip.
Example D:
In the example, we assume that both scalpers perform the same number of trades. In this case, the advantage lies clearly with the M1 Scalper, although the overall advantage is not so great. Of course, this is just a fictitious calculation that looks different for each Scalper. Working in the M1 with a stop of 0.5 pip is almost impossible. With the identification of the key candle, I was able to reach this 0.5 pip in the 8-tick chart. With the addition of the spread, I am lying on average of one pip risk. Price-to-earnings ratios of 1:10 are also achievable in the 8-tick chart, as one also draws his resistance and support zones in higher time units.
Let's summarize the benefits
Point A
Within 24 hours, eight times more candles are produced than in the M1. This forces you to react faster, but it also gives you more experience.
Point B
Although only 30% more candles are produced per zigzag line than in the M1, the speed of line formation in the 8-tick chart is significantly higher.
Point C
With 282 zigzag lines within one day, a new trend averages every 5 minutes, while the M1 takes an average of 30 minutes. So when I draw a resistance zone, I do not have to wait 30 minutes for a new chance, just 5 minutes. That's a big difference. This puts me in a position to pickup more trades within a short time.
Point D
With 996 Pip I get almost three times as much pip available that I can collect over the day. Since I can go short or long at any time, the possibilities are considerably greater. The most important point for me, which I have already posted several times, is the achievable Pip per minute. At 1440 minutes per day, I get 0.69 Pip per minute in the 8 Tickchart, while in the M1 I only make 0.25 Pip per minute. This is due to the significantly more educated ZigZaglinien.
The shorter I am in the market, the less risk I have of being stopped out by unforeseen price eruptions.
Since I have more zigzag lines available in the 8-tick chart, I can also reach my pip faster per minute. Of course, if an 8 Tickchart Scalper and an M1 Scalper start at the same time, they will reach the same number of pip in the first moment. But as soon as the trend changes, the 8 Tickchart Scalper gets out and trades in the opposite direction. The M1 Scalper is still in the trade because he expects another trend change in his direction.
Achieving 0.69 Pip instead of 0.25 Pip in one minute means:
In the same time, one reaches three times as much pip or in one third of the time one reaches the same pip. This is a very interesting risk minimization for me.
Of course, in an uptrend, it's dangerous to take the short pullback down. In the M1, this is often a high risk. Trading and flying have one thing in common. The most dangerous moment is the takeoff and landing. When trading, it is the entry and exit. This is where most mistakes are made. Therefore, the more candles I have available, the easier it is to determine resistance zones.
If I get eight times more candles a day, I'm also able to draw eight times more resistance and support lines. That means. At the same time I can learn eight times faster if my zones were drawn correctly.
This enables me to achieve a much better win rate than 50%. In addition, my broker will reimburse me for up to 25% of my paid spreads. This brings me to an average spread of 0.4 pip in EURUSD including all costs. This again increases the profit efficiency.
The only thing you need is a quick to run commercial screen. If you work with the MetaTrader I recommend the MT5, because the execution times are much faster. You should keep an eye on the ping times at the broker and your own internet provider and possibly optimize. VPS servers are an alternative.
All in all, I can say that as a scalper, I do not commit suicide on installments, but can be more than satisfied with the situation. Due to the very small stops, higher solder is easier to invest. It will be interesting if you accidentally get into a breakout. But I do not speculate on that, I prefer the normal trades. Small stop, high solder, quickly in and out again. Of course, sometimes something goes wrong, but I have eight times more chances a day and the next chance comes on average every 5 minutes.
When I started, and sometimes worked with stops of 30 or 40 pip, it was frustrating to watch my loss slowly get bigger and, with luck, I could easily finish in profit.
Of course, the course was often in the stronger profit, but then it was frightening to see how much of my profit I had to give up again, because the course suddenly changed the trend direction.
Scalpen means more freedom for me, because I do my trading business within a short time. This leaves me much more time available and I do not have to look at my screen all day to see if the course develops in my favor. Of course, I also occasionally run a trade with a trailing stop, but that does not stop me from scalping further. When I'm in the market with an order I'm sitting at the screen, when I'm free I'm not in the market. I found that calms the nerves tremendously.
I made losses with Scalping at the beginning because my stops were way too big. Although I managed to reduce my stops in the M1 to 3 pip, I was still not satisfied with the result. Every trader knows that optimizing one's own trading business is an eternal construction site. Even if you have found your trading direction, you can optimize it every day. And that you have to do, because the market will continue to develop.
There is a nice saying about it:
Learning is like rowing against the tide, as soon as you stop you're driven back.
I wish you a very successful trading day today
Best regards
Hello dear subscribers,
To work as an counter-trend scalper with an 8-tick chart would have to be suicide from a financial point of view. But why that is not the case and why I have decided to do it, I would like to show today. After having provided you with some self-made indicators that all have the sole aim of identifying the key candle, I would first like to talk about my skin screen and which auxiliary indicators I currently use in my dashboard.
Attached Image (click to enlarge)
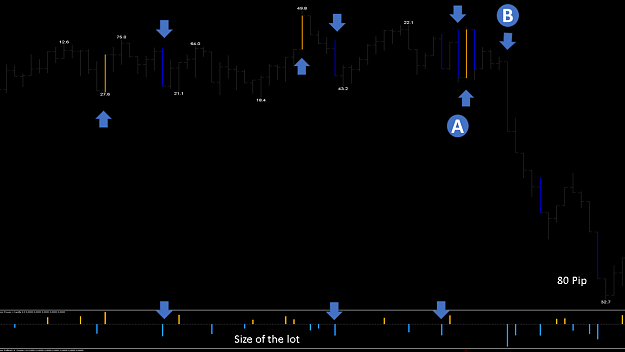
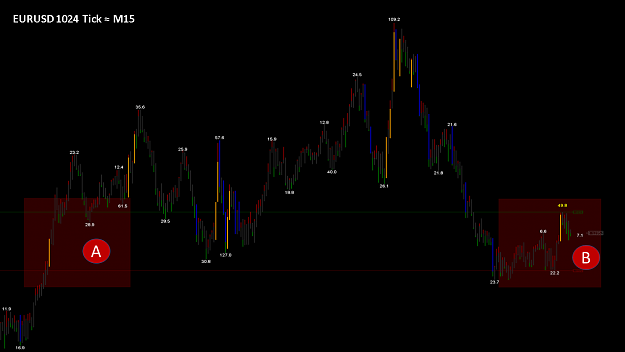
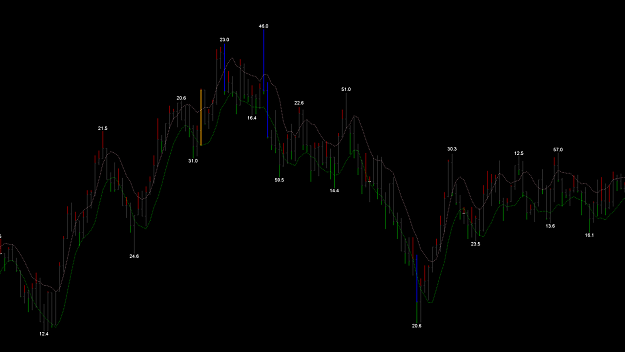
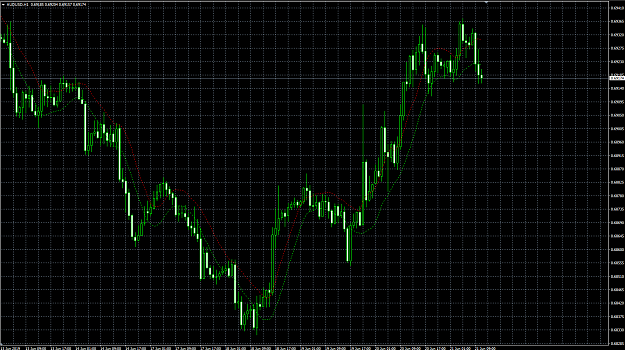
On my 55 inch monitor are relatively few auxiliary indicators to have a clear view of the candles. Let's take a closer look at the auxiliary indicators, most of which I have already published.
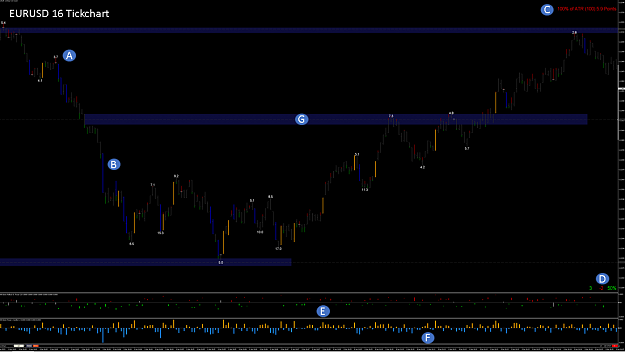
Point A
At the HH, HL, LH and LL you will see numbers. These numbers show the average pipettes per candle in the respective upward or downward trend. From this it is very easy to derive pullbacks and trend strengths.
Point B
An indicator (blue and yellow candles) that helps me find the tracks of the big players. He is variable and automatically changes the setting depending on the volatility.
Point C
A normal ATR indicator with the setting of the last 100 candles.
Point D
The indicator published yesterday that shows the strength of the last five candles. Especially with trend turning a very interesting tool.
Point E
This is an indicator that shows me exclusively the pullbacks of each movement. As I've already said, the pullbacks within a candle are more important to me than the movement itself.
Point F
A self-developed indicator that shows me the size of the solder used. The displayed strength I have modified with a special calculation formula.
Point G
I create the zones myself using the key candles identified in front of me. From this I deduce my trade. My stops are an average of 0.5 pip including the spread, which is a risk of about 1 pip. I try to realize a chance risk ratio of 1: 5 to 1:10, which is not always possible, because I work in the 8 Tickchart. In addition to my main screen, there are other screens where I watch the course in larger time units. All screens run in the tick chart only the trading screen run in M1.
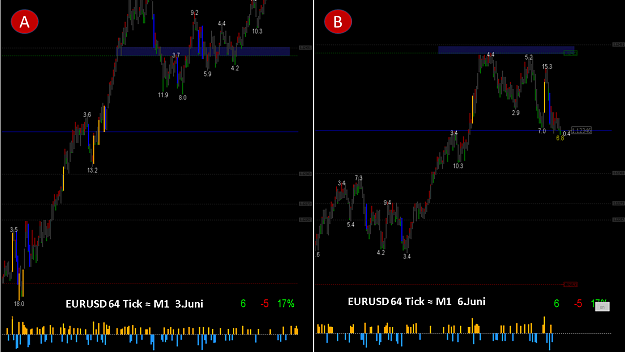
When I identify my key candles in the 8th Tick Chart, I'm interested in how the price reacts when it comes to these key zones. I created a dashboard for that. Enclosed a short video about the function. At the beginning of the three minutes, the course is initially in equilibrium and then runs down.
Dashboard video
Inserted Video
There is a lot of information on this dashboard, which basically only interests me when the course arrives in my key zone. With the indicators I have posted, they are also able to put together such a dashboard. My personal dashboard is an eternal building site, it is regularly updated and improved. If something does not help, it flies out. So I can experiment at least in this area. I chose the Tick Chart because it's the only chance to follow in the footsteps of the big players. In the last few months, I have set 20 different time units in the Tick Chart.
Attached Image (click to enlarge)
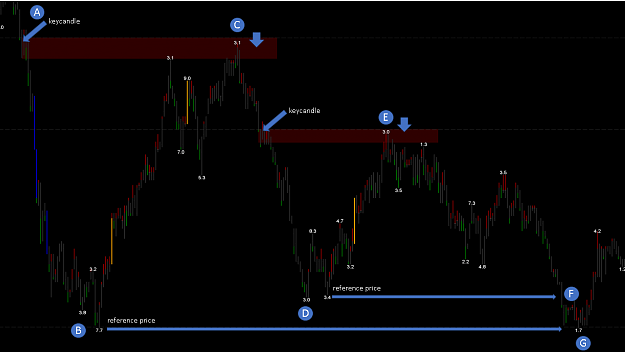
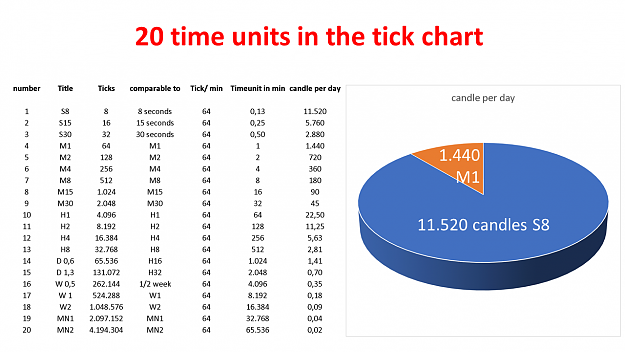
My time units range from the 8 second chart to the two month chart. On average, it generates 64 ticks per minute, and as time does not matter, I never find myself in the same time unit as most traders. If you do not want to lose, you have to act in time units in which the others are not on the way. On average, there are 11,520 candles a day in an 8-tick chart, while in a M1 there are just 1,440 candles. That's 700% more candles in one day. A big advantage: As volatility increases, more candles are formed. Breakouts are excellently broken down into smaller units. From this it is very easy to determine resistance zones.
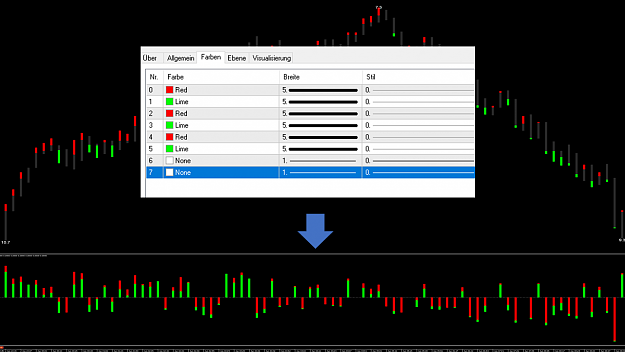
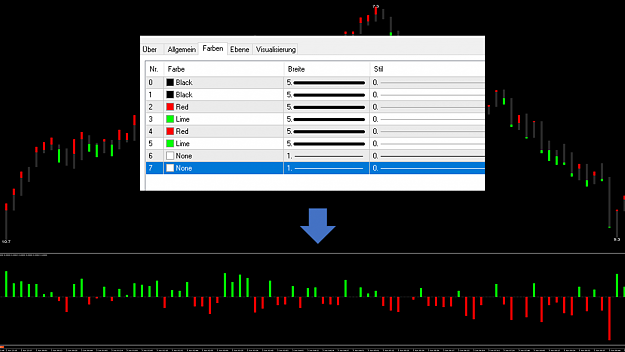
Attached Image (click to enlarge)
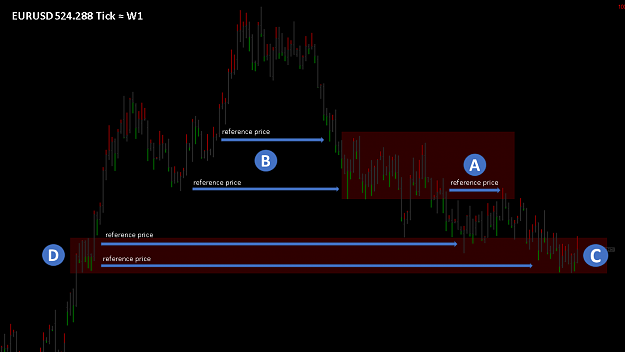
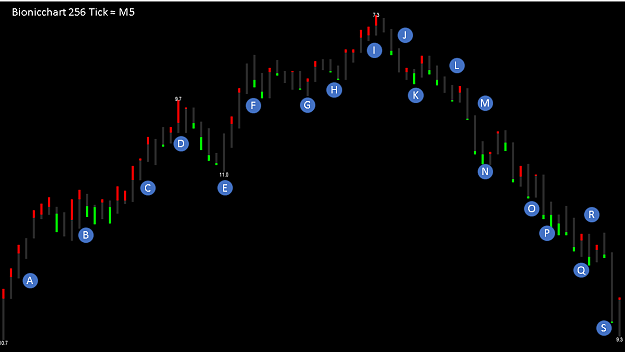
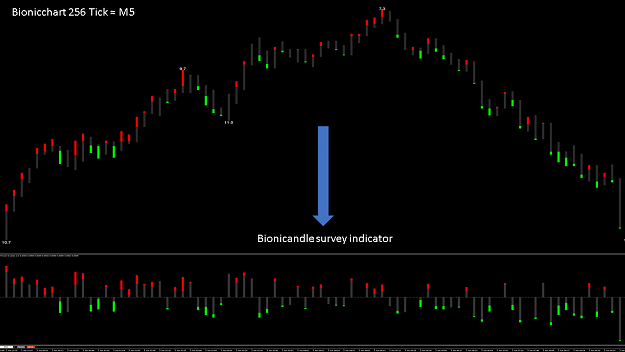
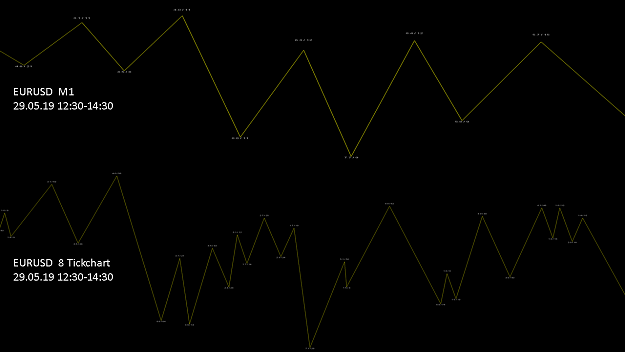
With a zigzag setting of 8/4/2, I once calculated the movements within a trading day. It is quite clear that within a same time period more movements take place in an 8-tick chart than in an M1. The period shown here in the chart is the same, but the candles in the tick chart are a bit different, although the price spikes are always the same.
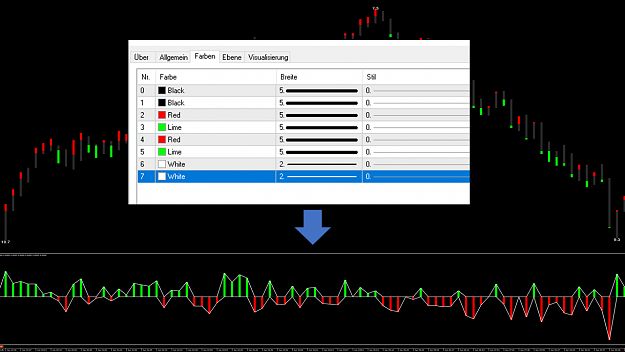
Attached Image (click to enlarge)
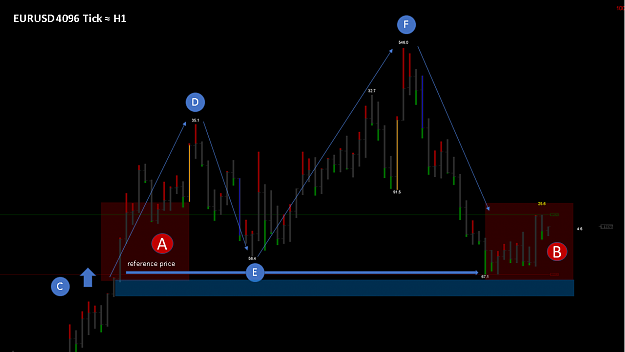
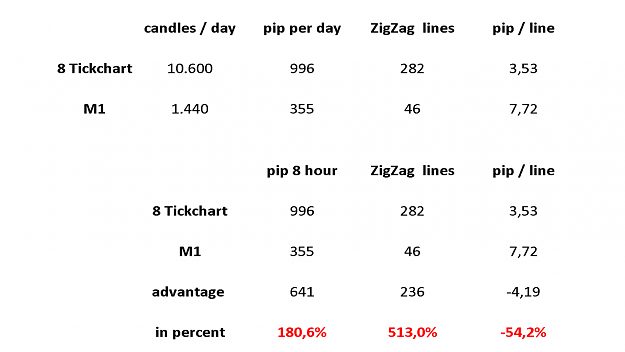
The result of May 29, 2019
In the 8th tickchart, 10,600 candles formed a total of 282 zigzag lines, which reached an average of 3.53 pips. In addition, we came in the range of 996 pip within 24 hours. In the M1 Chart, 1440 candles formed a total of 46 zigzag lines, averaging 7.72 pips. In addition, we came in the range to 355 pip within 24 hours.
Analyzing the 24 hours, we see that in an 8-tick chart, about 180% more pip are formed, as over 500% more moves occur in the zigzag lines. However, these zigzag lines reach only 3.53 pip instead of 7.72 pip. That's over 50% less.
Within this 24 hours 282 zigzag lines were created in the 8 Tickchart and in the M1 nearly 46 zigzag lines. In the following calculation, we assume that during the day the trader selects some of these trend trajectories and starts trading.
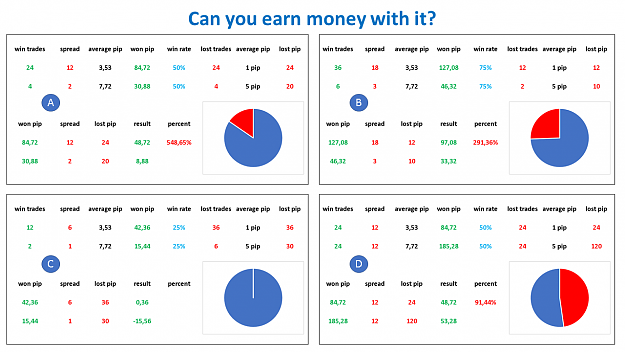
Since a scalper in the 8-tick chart has six times as many trend courses as in the M1, he also executes six times as many trades in the example. Let's make a comparison between an 8 Tickchart Scalper and an M1 Scalper. We analyzes 48 trades that take place within a certain period of time. Of course, the calculation is purely hypothetical, as a trading transaction depends on many factors.
Attached Image (click to enlarge)
Example A:
48 trades are executed with a 50% win rate. The spread is 0.5 pip in the case of profit and the total loss in the 8 tick chart is one pip. In M1, the total loss is five pip. I have made these experiences myself in recent years. We assume that both scalpers achieve the average pip size of 3.53 and 7.72, respectively. After a total of 48 trades, the 8 Tickchart Scalper achieved an advantage of 548% over the M1 Scalper.
Example B:
In the following case, the win rate was increased to 75%. The basic calculations are the same. It can be seen very nicely that after 48 trades there is still an advantage of almost 300% for the 8 Tickchart Scalper, but the advantage is reduced by an increase in the win quota.
Example C:
We now reduce the win rate to 25%. While the 8-Tick Scalper is still slightly in profit, the M1 Scalper has already lost more than 15 pip.
Example D:
In the example, we assume that both scalpers perform the same number of trades. In this case, the advantage lies clearly with the M1 Scalper, although the overall advantage is not so great. Of course, this is just a fictitious calculation that looks different for each Scalper. Working in the M1 with a stop of 0.5 pip is almost impossible. With the identification of the key candle, I was able to reach this 0.5 pip in the 8-tick chart. With the addition of the spread, I am lying on average of one pip risk. Price-to-earnings ratios of 1:10 are also achievable in the 8-tick chart, as one also draws his resistance and support zones in higher time units.
Attached Image (click to enlarge)
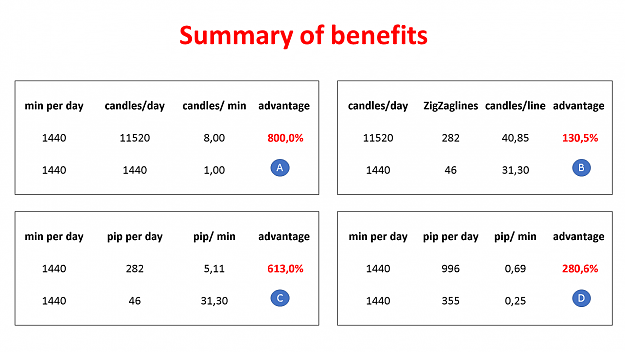
Let's summarize the benefits
Point A
Within 24 hours, eight times more candles are produced than in the M1. This forces you to react faster, but it also gives you more experience.
Point B
Although only 30% more candles are produced per zigzag line than in the M1, the speed of line formation in the 8-tick chart is significantly higher.
Point C
With 282 zigzag lines within one day, a new trend averages every 5 minutes, while the M1 takes an average of 30 minutes. So when I draw a resistance zone, I do not have to wait 30 minutes for a new chance, just 5 minutes. That's a big difference. This puts me in a position to pickup more trades within a short time.
Point D
With 996 Pip I get almost three times as much pip available that I can collect over the day. Since I can go short or long at any time, the possibilities are considerably greater. The most important point for me, which I have already posted several times, is the achievable Pip per minute. At 1440 minutes per day, I get 0.69 Pip per minute in the 8 Tickchart, while in the M1 I only make 0.25 Pip per minute. This is due to the significantly more educated ZigZaglinien.
The shorter I am in the market, the less risk I have of being stopped out by unforeseen price eruptions.
Since I have more zigzag lines available in the 8-tick chart, I can also reach my pip faster per minute. Of course, if an 8 Tickchart Scalper and an M1 Scalper start at the same time, they will reach the same number of pip in the first moment. But as soon as the trend changes, the 8 Tickchart Scalper gets out and trades in the opposite direction. The M1 Scalper is still in the trade because he expects another trend change in his direction.
Achieving 0.69 Pip instead of 0.25 Pip in one minute means:
In the same time, one reaches three times as much pip or in one third of the time one reaches the same pip. This is a very interesting risk minimization for me.
Of course, in an uptrend, it's dangerous to take the short pullback down. In the M1, this is often a high risk. Trading and flying have one thing in common. The most dangerous moment is the takeoff and landing. When trading, it is the entry and exit. This is where most mistakes are made. Therefore, the more candles I have available, the easier it is to determine resistance zones.
If I get eight times more candles a day, I'm also able to draw eight times more resistance and support lines. That means. At the same time I can learn eight times faster if my zones were drawn correctly.
This enables me to achieve a much better win rate than 50%. In addition, my broker will reimburse me for up to 25% of my paid spreads. This brings me to an average spread of 0.4 pip in EURUSD including all costs. This again increases the profit efficiency.
The only thing you need is a quick to run commercial screen. If you work with the MetaTrader I recommend the MT5, because the execution times are much faster. You should keep an eye on the ping times at the broker and your own internet provider and possibly optimize. VPS servers are an alternative.
All in all, I can say that as a scalper, I do not commit suicide on installments, but can be more than satisfied with the situation. Due to the very small stops, higher solder is easier to invest. It will be interesting if you accidentally get into a breakout. But I do not speculate on that, I prefer the normal trades. Small stop, high solder, quickly in and out again. Of course, sometimes something goes wrong, but I have eight times more chances a day and the next chance comes on average every 5 minutes.
When I started, and sometimes worked with stops of 30 or 40 pip, it was frustrating to watch my loss slowly get bigger and, with luck, I could easily finish in profit.
Of course, the course was often in the stronger profit, but then it was frightening to see how much of my profit I had to give up again, because the course suddenly changed the trend direction.
Scalpen means more freedom for me, because I do my trading business within a short time. This leaves me much more time available and I do not have to look at my screen all day to see if the course develops in my favor. Of course, I also occasionally run a trade with a trailing stop, but that does not stop me from scalping further. When I'm in the market with an order I'm sitting at the screen, when I'm free I'm not in the market. I found that calms the nerves tremendously.
I made losses with Scalping at the beginning because my stops were way too big. Although I managed to reduce my stops in the M1 to 3 pip, I was still not satisfied with the result. Every trader knows that optimizing one's own trading business is an eternal construction site. Even if you have found your trading direction, you can optimize it every day. And that you have to do, because the market will continue to develop.
There is a nice saying about it:
Learning is like rowing against the tide, as soon as you stop you're driven back.
I wish you a very successful trading day today
Best regards
Forget:That does not work, amateurs build the ark, pros the Titanic!
4