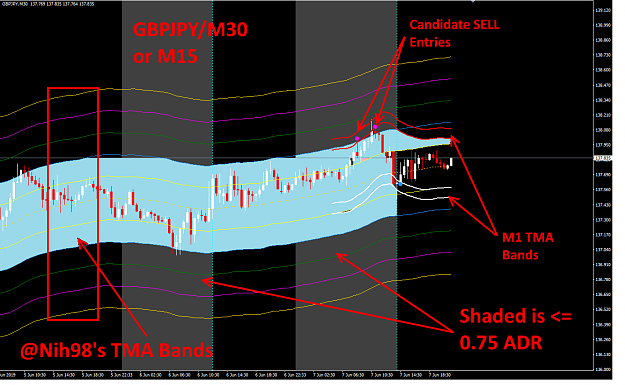
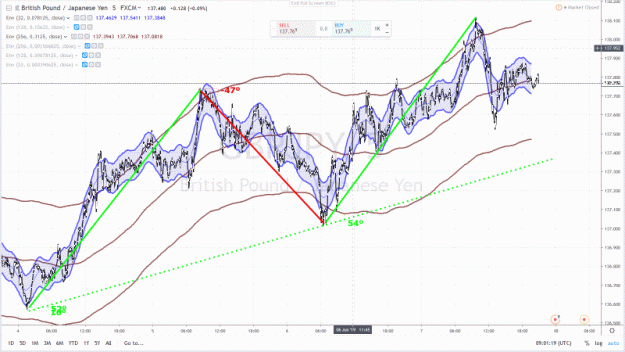
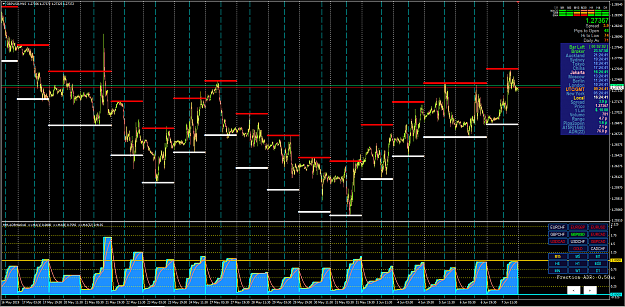
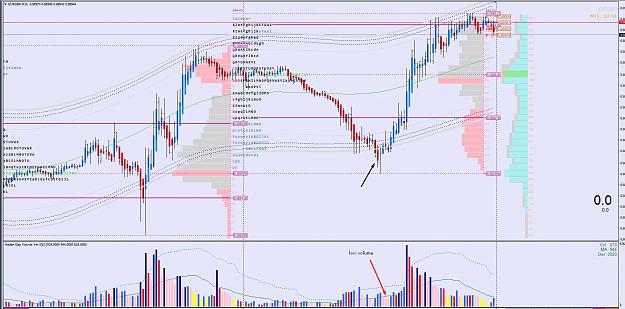
DislikedPossible way to trade reversals and or pullbacks 1) Use H4 chart to see if the market is Ranging or Trending (screenshot shows PA moving upwards not breaking below dotted Mean Line) 2) M15 look for pullbacks into the White Lines) 3) Extra filter would be MACD divergence. 4) Wait for candle to close above White Line in direction of the Mean TP would be based on your own R:R Management. If H4 chart shows the market is Ranging (no real Trend) PA crossing the Mean from both directions many times, then it is more likely that you could take reversal trades...Ignored
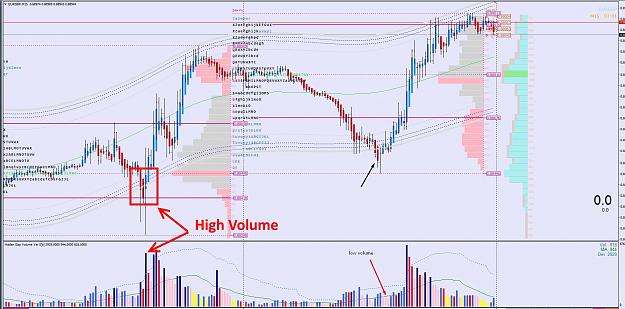
Attached Image (click to enlarge)
2