This is a continuation of post #2475 where I explained the role of the ADR indicator. In this post I will explain how I use the TMA indicator.
First -- not all TMA indicators are created equal. For example, there are TMA indicators that repaint and those that do not. There is nothing inherently wrong with repainting and it may actually suit certain applications. However, in our case, repainting is not desirable. I've tested a number of non-repainting TMA indicators and my favorite is the one @Nih98 has made available. The name of his TMA indicator is called "! NIH98 !TMA True Force Indi.ex4" and you can find it on his thread at https://www.forexfactory.com/showthread.php?t=915096. @George uses a TMA indicator that was initially introduced by @Namor in the thread "scalping template tma" -- here is the link: https://www.forexfactory.com/showthread.php?p=11304519#post11304519. @George also posted that indicator on his thread in post #4 but he forgot to give credit -- perhaps a simple oversight.
I prefer @Nih98's TMA indicator for the following reasons:
1. First and foremost -- it uses lots of colors and reminds me of a Christmas tree. This is crucial when it comes to trading.
2. It doesn't repaint.
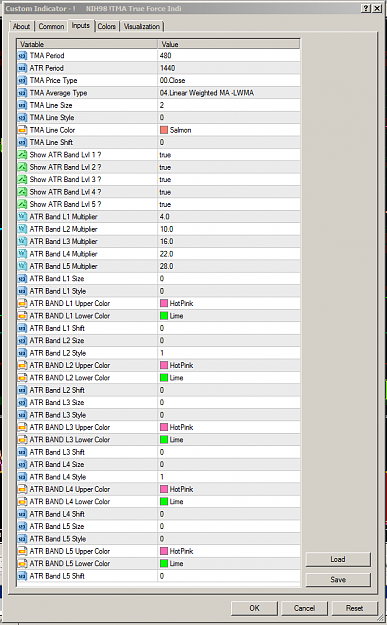
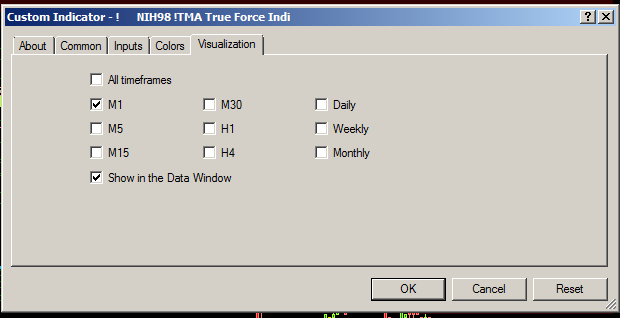
3. He provides all the levels and TMA settings. He even includes a screen shot of the input dialog box with all his settings. He doesn't play games. He doesn't answer questions with riddles or insults. It is almost as if @Nih98 wants those of us out to here to actually succeed at using his indicator. What an amazing concept. Who would have thought?
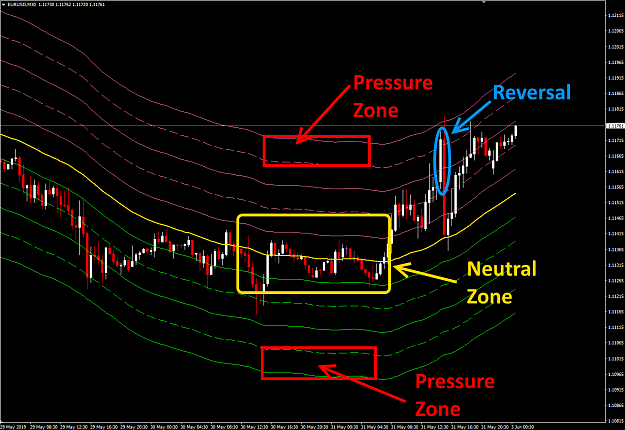
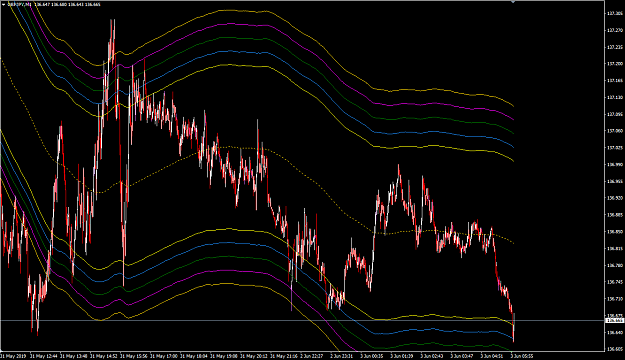
The TMA indicator is used to trade reversals -- always. I'll repeat -- the TMA is used to trade reversals. It is not used to predict spikes or catch falling knives. @moodybot refers to it as "waiting for the MM to show its hand".
Check-out the screen shot above of @Nih98's TMA indicator. You see "Pressure Zones", a "Neutral Zone" and an example of a reversal. When trading TMA we look for an extreme and anticipate a reversal. An extreme occurs when the price enters a Pressure Zone. I'm not sure who first called these areas Pressure Zones, but I assume it's because the price is under pressure to return (i.e. revert or reverse) back to the "fair value" or "equilibrium" price in the Neutral Zone. It is possible to trade within the Neutral Zone, and many do, but "TMA Reversal" trading occurs when price enters a Pressure Zone.
Okay -- so how do we actually trade the TMA? It's almost too easy. There are numerous variations of how to trade the TMA. I'll show you one, but this is by no means the only one. I suspect all the variations share the same general approach, but may differ in terms of time frames, TMA settings, etc. The details don't matter much. If you grasp the general approach then no doubt you can tailor it to what works best for you.
When trading TMA you can (a) trade M1 charts, or (b) trade HTF (Higher Time Frame) charts. Trading M1 charts requires different TMA settings than HTF charts. Here I am concerned only with HTF charts -- and by HTF I mean M30, H1 and H4. As a rookie all this switching between time frames used to confuse me -- e.g. do I start with M30 and look higher or do I start higher and look lower. No one explains the rationale, right? Now I get it -- not because I spent an additional 1000 hours of screen time but, rather, because one person had the patience to explain it to me in simple terms. So, that is what I'd like to pass along.
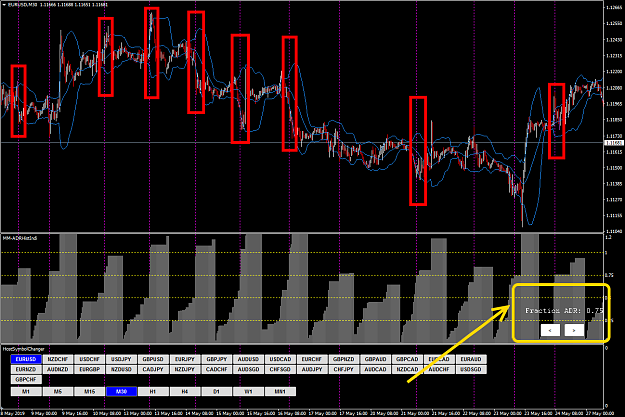
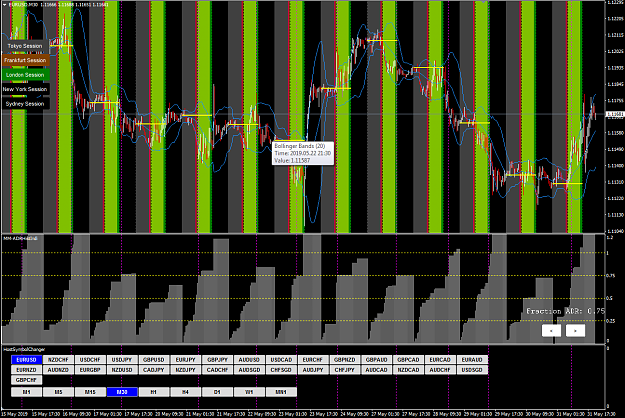
When you look at an M30 price chart with TMA bands you will see many extremes poking through to Pressure Zones. When you look at an H4 price chart with TMA bands you will see fewer extremes poking through to Pressure Zones. This is because at a lower time frame the price granularity or resolution is much finer and, so, the differences appear greater. Furthermore, extremes that appear at M30 may not be apparent at H4. On the other hand, extremes at H4 will always appear at M30. So, you can almost consider H4 as a filter -- that is, it filters-out "fake" extremes. That is not actually correct -- one could certainly trade extremes that only occur at the lower TF. However, for my purposes here, I am only interested in extremes that appear at H4. When an extreme appears at H4 then I will down shift to M30 (or H1) and if my other clues are consistent will open a BUY or SELL trade at the lower time frame.
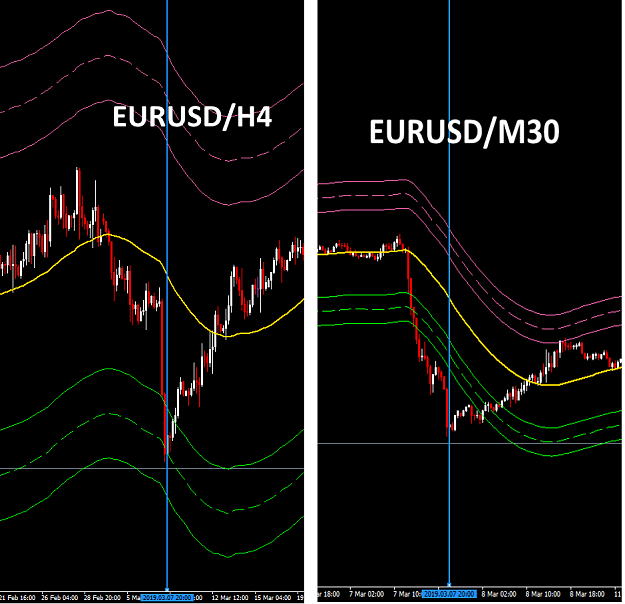
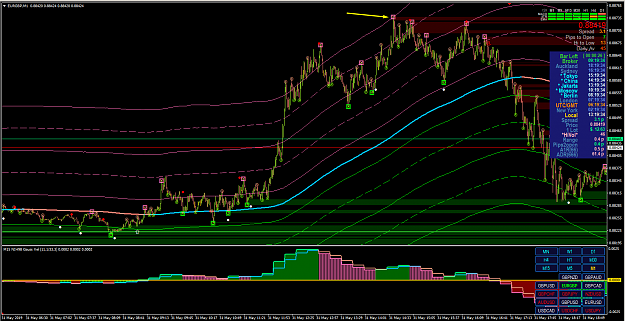
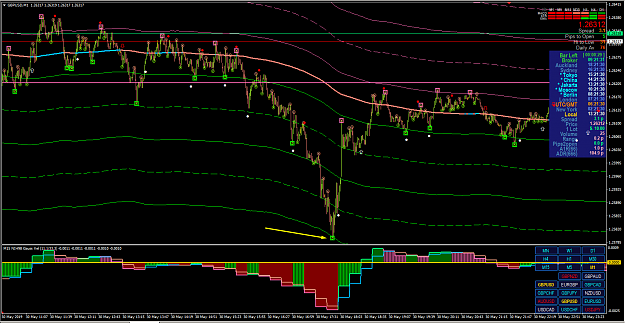
Take a look at the screen shots above. On the left is EURUSD/H4 and on the right is EURUSD/M30. On EURUSD/H4 I found an extreme that poked downward into a Pressure Zone so I marked it with a vertical line and down shifted to EURUSD/M30 and found my vertical line. Remember, I'm looking to trade a reversal. Since the price was falling then I'm looking for it to reverse so that I can enter a BUY. Since the price resolution is better on an EURUSD/M30 (compared to H4) then I can better see when the reversal begins. Or, I can actually begin opening multiple BUY orders as the price continues to fall (and before the reversal is reached) because I'm pretty sure the price will eventually reverse.
Though I'm a rookie trader, I am embarrassed to admit I'm an infant when it comes to money management. At this point I'm more focused on whether a strategy gets the Entry right. So, when I enter a new trade on M30 (or H1) I'll use a StopLoss of 20 Pips and a TakeProfit of 10 Pips -- something like that. Even though I often leave pips on the table, the win rate is sufficiently high that I still come out ahead. But, again, the important thing for me at this point is to gain confidence that we can consistently make good Entries, and then we'll worry about the details of money management.
First -- not all TMA indicators are created equal. For example, there are TMA indicators that repaint and those that do not. There is nothing inherently wrong with repainting and it may actually suit certain applications. However, in our case, repainting is not desirable. I've tested a number of non-repainting TMA indicators and my favorite is the one @Nih98 has made available. The name of his TMA indicator is called "! NIH98 !TMA True Force Indi.ex4" and you can find it on his thread at https://www.forexfactory.com/showthread.php?t=915096. @George uses a TMA indicator that was initially introduced by @Namor in the thread "scalping template tma" -- here is the link: https://www.forexfactory.com/showthread.php?p=11304519#post11304519. @George also posted that indicator on his thread in post #4 but he forgot to give credit -- perhaps a simple oversight.
I prefer @Nih98's TMA indicator for the following reasons:
1. First and foremost -- it uses lots of colors and reminds me of a Christmas tree. This is crucial when it comes to trading.
2. It doesn't repaint.
3. He provides all the levels and TMA settings. He even includes a screen shot of the input dialog box with all his settings. He doesn't play games. He doesn't answer questions with riddles or insults. It is almost as if @Nih98 wants those of us out to here to actually succeed at using his indicator. What an amazing concept. Who would have thought?
Attached Image (click to enlarge)
The TMA indicator is used to trade reversals -- always. I'll repeat -- the TMA is used to trade reversals. It is not used to predict spikes or catch falling knives. @moodybot refers to it as "waiting for the MM to show its hand".
Check-out the screen shot above of @Nih98's TMA indicator. You see "Pressure Zones", a "Neutral Zone" and an example of a reversal. When trading TMA we look for an extreme and anticipate a reversal. An extreme occurs when the price enters a Pressure Zone. I'm not sure who first called these areas Pressure Zones, but I assume it's because the price is under pressure to return (i.e. revert or reverse) back to the "fair value" or "equilibrium" price in the Neutral Zone. It is possible to trade within the Neutral Zone, and many do, but "TMA Reversal" trading occurs when price enters a Pressure Zone.
Okay -- so how do we actually trade the TMA? It's almost too easy. There are numerous variations of how to trade the TMA. I'll show you one, but this is by no means the only one. I suspect all the variations share the same general approach, but may differ in terms of time frames, TMA settings, etc. The details don't matter much. If you grasp the general approach then no doubt you can tailor it to what works best for you.
When trading TMA you can (a) trade M1 charts, or (b) trade HTF (Higher Time Frame) charts. Trading M1 charts requires different TMA settings than HTF charts. Here I am concerned only with HTF charts -- and by HTF I mean M30, H1 and H4. As a rookie all this switching between time frames used to confuse me -- e.g. do I start with M30 and look higher or do I start higher and look lower. No one explains the rationale, right? Now I get it -- not because I spent an additional 1000 hours of screen time but, rather, because one person had the patience to explain it to me in simple terms. So, that is what I'd like to pass along.
When you look at an M30 price chart with TMA bands you will see many extremes poking through to Pressure Zones. When you look at an H4 price chart with TMA bands you will see fewer extremes poking through to Pressure Zones. This is because at a lower time frame the price granularity or resolution is much finer and, so, the differences appear greater. Furthermore, extremes that appear at M30 may not be apparent at H4. On the other hand, extremes at H4 will always appear at M30. So, you can almost consider H4 as a filter -- that is, it filters-out "fake" extremes. That is not actually correct -- one could certainly trade extremes that only occur at the lower TF. However, for my purposes here, I am only interested in extremes that appear at H4. When an extreme appears at H4 then I will down shift to M30 (or H1) and if my other clues are consistent will open a BUY or SELL trade at the lower time frame.
Attached Image (click to enlarge)
Take a look at the screen shots above. On the left is EURUSD/H4 and on the right is EURUSD/M30. On EURUSD/H4 I found an extreme that poked downward into a Pressure Zone so I marked it with a vertical line and down shifted to EURUSD/M30 and found my vertical line. Remember, I'm looking to trade a reversal. Since the price was falling then I'm looking for it to reverse so that I can enter a BUY. Since the price resolution is better on an EURUSD/M30 (compared to H4) then I can better see when the reversal begins. Or, I can actually begin opening multiple BUY orders as the price continues to fall (and before the reversal is reached) because I'm pretty sure the price will eventually reverse.
Though I'm a rookie trader, I am embarrassed to admit I'm an infant when it comes to money management. At this point I'm more focused on whether a strategy gets the Entry right. So, when I enter a new trade on M30 (or H1) I'll use a StopLoss of 20 Pips and a TakeProfit of 10 Pips -- something like that. Even though I often leave pips on the table, the win rate is sufficiently high that I still come out ahead. But, again, the important thing for me at this point is to gain confidence that we can consistently make good Entries, and then we'll worry about the details of money management.
1
12