You can a use a period converter tht would get them for you ,, Ill try and find the one I use or at least a place ya can get it ,, Maybe M can give the info to ya ,, I never kept it or just google period converter you will find one
{quote} You can a use a period converter tht would get them for you ,, Ill try and find the one I use or at least a place ya can get it ,, Maybe M can give the info to ya ,, I never kept it or just google period converter you will find one
{quote} I’ll google that never heard of period converters
Ignored
think its percon or something like tht ,, 8 hour with weekly levels from mete so you can definitely get them my other ya see posted all the time below it
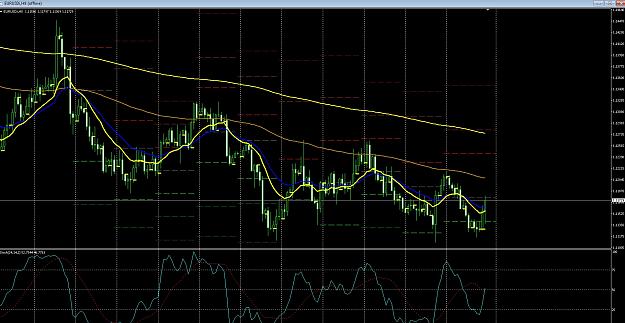
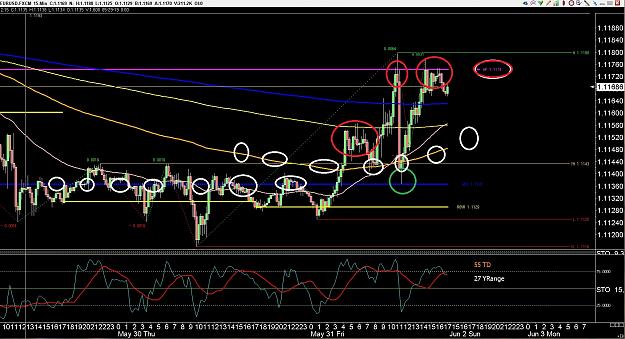
{quote} I shorted just on the resistance of SMA50 {image}
Ignored
I see I only use 200sma. I went short because it had broke an H4 fractal and thought that it would go below and break the lower fractal on H4 before going up to. 1.12 area. I’m going to look to short again at 1.1200-1.1215 aiming for 1.1070
{quote} I shorted just on the resistance of SMA50 {image}
Ignored
which is Im sure you know just the hourly 200 ,, especially great if a good level around it ,, however ya have to becareful if no level around it ,, averages are just guides ,, nothing more nothing less ,, they are areas where some follow thru may come in ,, no good level around them ,,becareful ,, look to previous week and make sure something there tht mkt used
Joined Jan 2010
|
Status: The Voodoo Boodoo Club
|37,698 Posts
Ws1 price couldnt sty below ,, yes,, nice sell off from weekly pivot ,, bought right back up and chipping away at pivot again and above hourly 200 to close week out
Joined Jan 2010
|
Status: The Voodoo Boodoo Club
|37,698 Posts
pattern in your favor but m15 200 and m5 200 ,, above a weekly ave price yada yada all support areas now and it did claw back last weeks fifty percent level ,, the chess match will continue but atm above some sht term shit
{quote} I see I only use 200sma. I went short because it had broke an H4 fractal and thought that it would go below and break the lower fractal on H4 before going up to. 1.12 area. I’m going to look to short again at 1.1200-1.1215 aiming for 1.1070
Ignored
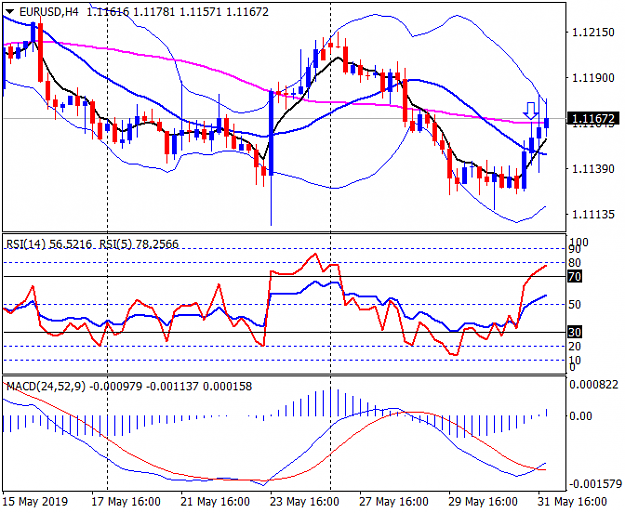
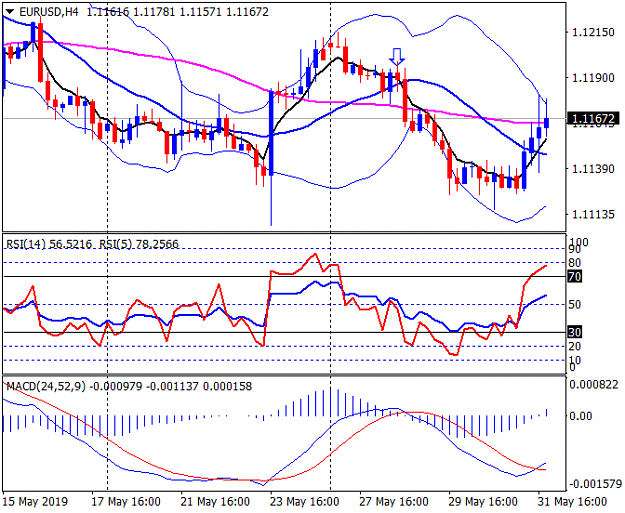
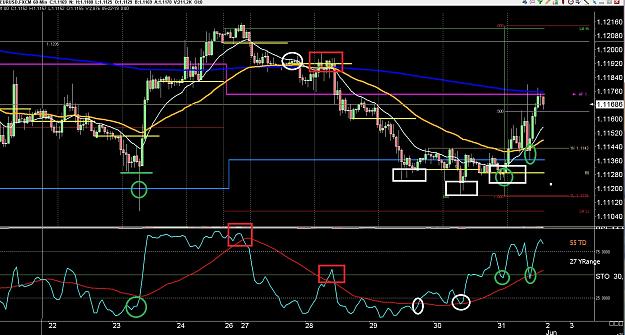
Beaware EMA5 cross and MACD cross have happened.Further if any H4 candle close above 1.11984, under arrow, EU is likely to go up while daily candles are also showing long biased
Joined Jan 2010
|
Status: The Voodoo Boodoo Club
|37,698 Posts
and where is best areas ,,, not saying the pivot wont hold ,, but areas to sell in reach now ,, nobody poured it on down around a new yearly low ,, think any one want s to really sell over half way back to last sell off area ,,,, they may but its above some sht term shit is all Im saying lol ,, maybe a big fish use a few long orders they have to fill anyway to geter back to an area worth a little more to sell and just so no confusion ,, the blue average on this chart is a 400 ema not a 200 ,,m15 posted tht is an hourly 200
{quote} Beaware EMA5 cross and MACD cross have happened.Further if any H4 candle close above 1.11984, under arrow, EU is likely to go up while daily candles are also showing long biased{image}
Ignored
were they not all crossed on left side of chart also ,,nothing a strait shot bud never was never will be ,, especially in a congested area like this,,big arera to left they couldnt drive er down ,, now looks more like divergnce in macd and rsi is flipped around other way ,, beware of clues tht point maybe to other things atm ,, or at least a bit of caution and a better level
{quote} Beaware EMA5 cross and MACD cross have happened.Further if any H4 candle close above 1.11984, under arrow, EU is likely to go up while daily candles are also showing long biased{image}
Ignored
I’m not familiar with indicators I only use fractals and a 200sma. I thought most indicators were always way behind current price
{quote} I’m not familiar with indicators I only use fractals and a 200sma. I thought most indicators were always way behind current price
Ignored
not as far as one would think at times ,,depends on settings too and you should be real familiar with how they work they can be way early at times too ,, but with practice ya know what to be looking for in price , and around what levels ,,, which will be the same ole culprit levels things always happen at lol,ya start piecing it together ,, those spike areas ,, usually a fuel drop where mkt does exact oppisite of wht one would think with negative or positive news lol
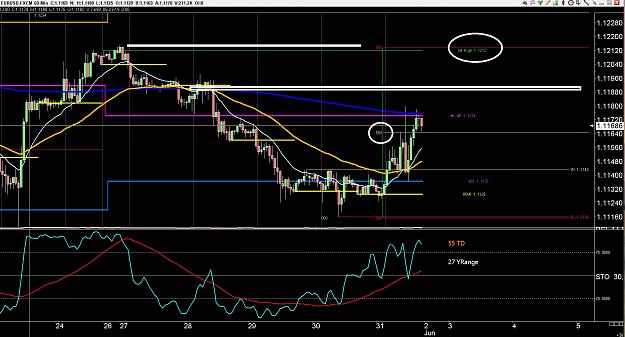
{quote} were they not all crossed on left side of chart also ,,nothing a strait shot bud never was never will be ,, especially in a congested area like this,,big arera to left they couldnt drive er down ,, now looks more like divergnce in macd and rsi is flipped around other way ,, beware of clues tht point maybe to other things atm ,, or at least a bit of caution and a better level {image}
Ignored
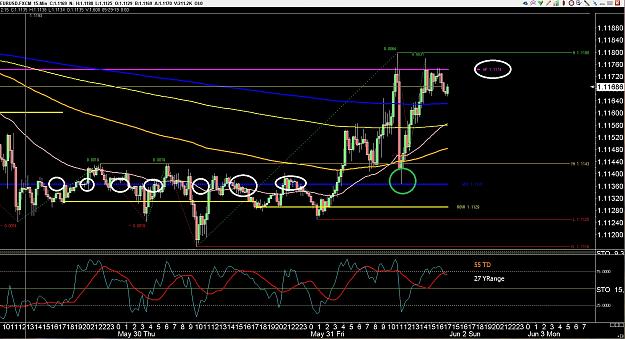
Good digger1, I was not discussing divergence intentionally just to keep it simple. Look now
My trading style is;
1- DIVERGENCE THROUGH RSI 5
2- CROSS OF EMA5 & MIDDLE BB + MACD CROSS
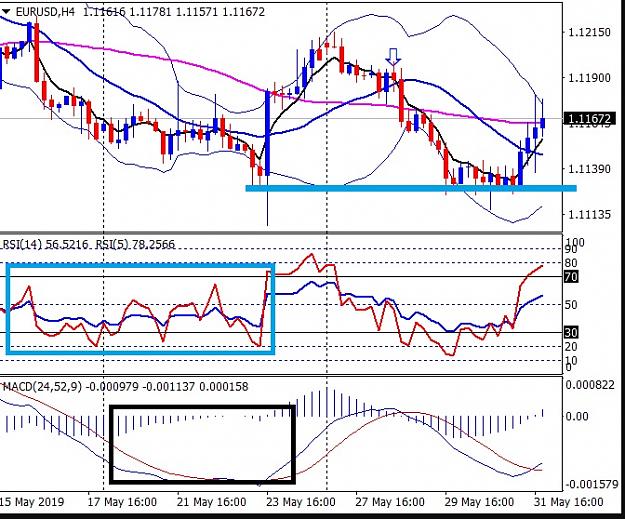
Plz see the graph
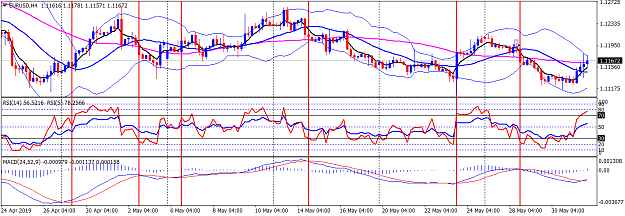
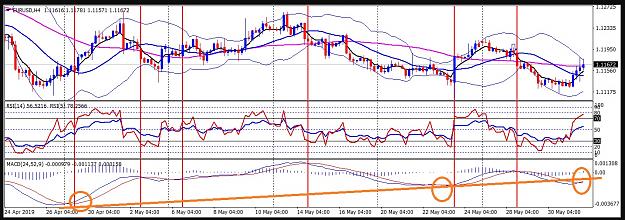
{quote} Good digger1, I was not discussing divergence intentionally just to keep it simple. Look now My trading style is; 1- DIVERGENCE THROUGH RSI 5 2- CROSS OF EMA5 & MIDDLE BB + MACD CROSS Plz see the graph{image}
Ignored
graph or not ,, thts back to the rigid rules and things like tht mkt must do this or the mkt must do tht ,, the mkt dont have to do shit ,, its gonna do what it always does ,, ,,not criticizing bud ,, just saying everything no matter what doesent always work out tht way and there is reasons ,, glad you are posting some charts ,, I see what you are looking at ,, just saying there is 2 sides to everything and a lot times when things look the easiest and so strait forward ,, they dont work out like tht lol,, you are in, you have your risk tolerance. ,, thts all good man ,, you showed your reasons m ost peoples idea of divergence ,, not to keep talking about it lol is far from the kind tht really move a mkt
{quote} Good digger1, I was not discussing divergence intentionally just to keep it simple. Look now My trading style is; 1- DIVERGENCE THROUGH RSI 5 2- CROSS OF EMA5 & MIDDLE BB + MACD CROSS Plz see the graph{image}
Ignored
not saying at all thts whats coming ,, but on something tht is slow as macd ,,tht kinda divergence sometimes leads to things ,, lol,, and tht kind is a part of trading one worth noting here and there ,,thts all I was pointing out ,,little flag goes up when I hear stuff like beware this or tht ,, nothing more man ,, I try not to be biased ,,I dont care which way it goes ,,I just need a little movement lol ill make my shekels one way or the other
{quote} graph or not ,, thts back to the rigid rules and things like tht mkt must do this or the mkt must do tht ,, the mkt dont have to do shit ,, its gonna do what it always does ,, ,,not criticizing bud ,, just saying everything no matter what doesent always work out tht way and there is reasons ,, glad you are posting some charts ,, I see what you are looking at ,, just saying there is 2 sides to everything and a lot times when things look the easiest and so strait forward ,, they dont work out like tht lol,, you are in, you have your risk tolerance....
Ignored
BIG THANKS, I do not call them rules, it is all speculation and what happens mostly, more than 90%, I try to operate that. Mkt must do not do as per indicators and I lost a trade as i earlier said SMA50 resistance not honored and i took loss.
Good wishes
Joined Jan 2010
|
Status: The Voodoo Boodoo Club
|37,698 Posts
A lot of people had gold dropping like a rock by now ,, it was finally gonn just drop ,, ,,it may yet ,, but it didnt from a quarterly low ,, a low which many thought was broken ,,gotta hold below it ,,it was damaged ,, but not broke as of yet ,,have to see what happens the next time its down there ,,, most mkts dont move as fast as it seems ,, just days strung into weeks and weeks of the ole chess match back and forth ,, shit can be stuck in areas for years gold has been in one for about 6 years now ,, ole weekly 200 sneaking up for support ,, makes one wonder why eur dont just plunge ,, well its just below the ole weekly 200 ,, wht if it dont sty below bout same time gold finally hits it 200 ,,, ,, takes years for all this shit to play out ,, but we get enough pieces we can do all rite ,,helps if ya keep things in context week to week ,, any rate ,, good chatting with ya folks ,,gots to run traders