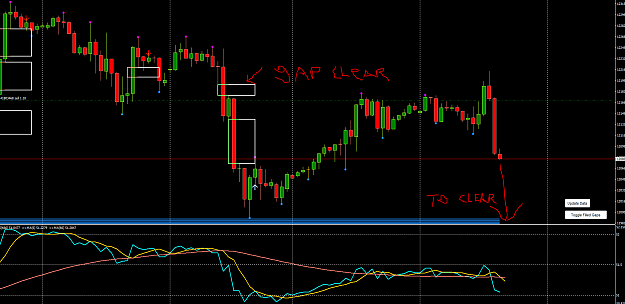
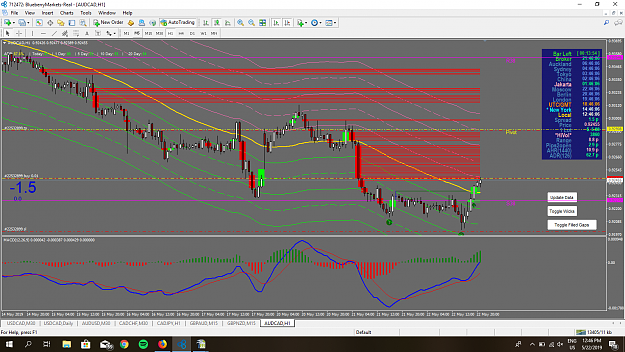
Disliked{quote} Hi Steve LG's create micro gaps which is really just the thinning of Liquidity in real trading terms. I am just reading the gaps, how many and over what range do they position themselves. I trade these micro gaps on the 1 minute chart and they normally always get filled. Macro & micro gaps read the same to me. Here is an example tonight on the AUDJPY I was trading. Notice all these LG's were filled except for the major one ahead of the price. This long ranging candle produced a One minute candle that was over 27 pips long. There would of...Ignored
Attached Image (click to enlarge)
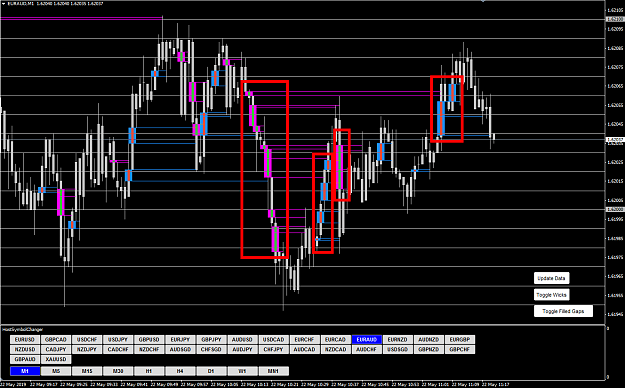
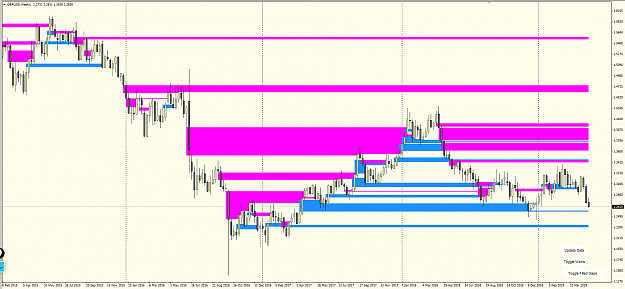
On a M1 chart you can watch the Ask line jiggle with each incoming tick and, sure enough, you can fairly accurately guess which direction it will move to fill a nearby gap. I've attached an image where there are clusters of bullish or bearish gaps, or one relatively large gap. And, sure enough, you can watch them get filled. It is hard to do this justice with just a screen shot -- you need to watch this in real-time on an M1 chart to really appreciate the price action.
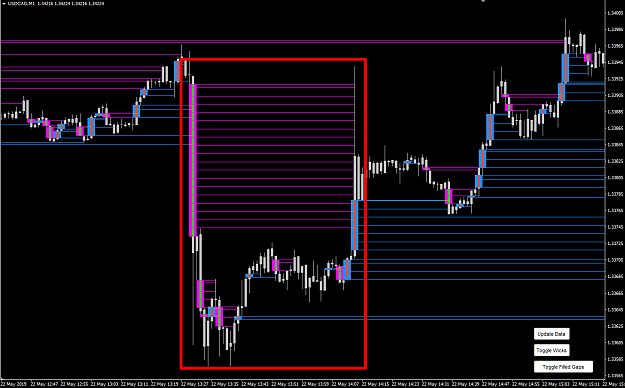
As a rookie trader, I'm noticing it is tricky to trade M1 -- not so much because of the patterns but, rather, because the bar sizes are small and even when you win trades the spread takes a big bite out of your win. So, that's why when you trade M1 you need to find either a large liquidity gap (like the 27-pip one that @RickM mentioned), or a string of them one right after the other (like the bearish ones in highlighted by the first red rectangle in the screen shot above).
3