ITB - Seeing Orderliness amongst 'Randomness'
- #102
- Apr 25, 2019 3:11am Apr 25, 2019 3:11am
- Joined Jun 2010 | Status: Trader | 16,699 Posts
ITB - Seeing Orderliness amongst 'Randomness'
- #103
- Apr 25, 2019 3:18am Apr 25, 2019 3:18am
- Joined Jun 2010 | Status: Trader | 16,699 Posts
ITB - Seeing Orderliness amongst 'Randomness'
- #104
- Apr 25, 2019 3:22am Apr 25, 2019 3:22am
- Joined Jun 2010 | Status: Trader | 16,699 Posts

ITB - Seeing Orderliness amongst 'Randomness'
- #105
- Apr 25, 2019 3:42am Apr 25, 2019 3:42am
- Joined Jun 2010 | Status: Trader | 16,699 Posts
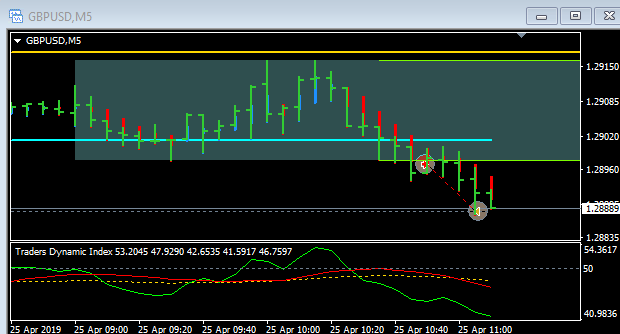
ITB - Seeing Orderliness amongst 'Randomness'
- #108
- Edited 4:17am Apr 25, 2019 4:00am | Edited 4:17am
- Joined Jun 2010 | Status: Trader | 16,699 Posts

ITB - Seeing Orderliness amongst 'Randomness'
- #109
- Apr 25, 2019 4:52am Apr 25, 2019 4:52am
- Joined Jun 2010 | Status: Trader | 16,699 Posts

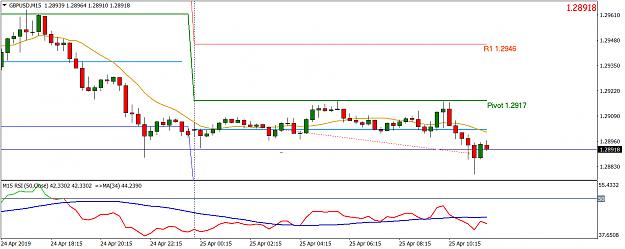
ITB - Seeing Orderliness amongst 'Randomness'
- #111
- Apr 25, 2019 6:39am Apr 25, 2019 6:39am
- Joined Jun 2010 | Status: Trader | 16,699 Posts
ITB - Seeing Orderliness amongst 'Randomness'
- #112
- Apr 25, 2019 6:42am Apr 25, 2019 6:42am
- Joined Jun 2010 | Status: Trader | 16,699 Posts
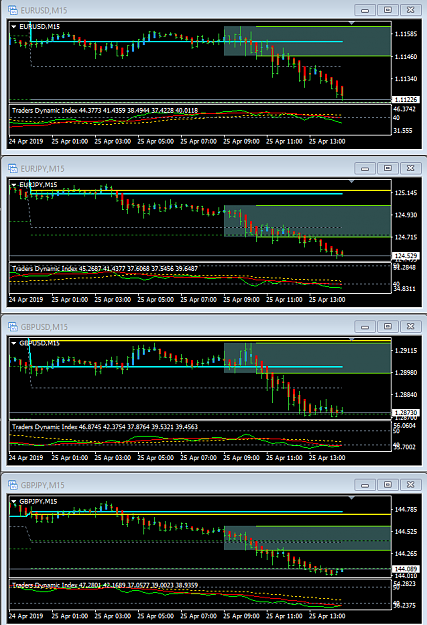
ITB - Seeing Orderliness amongst 'Randomness'
- #113
- Apr 25, 2019 6:46am Apr 25, 2019 6:46am
- Joined Jun 2010 | Status: Trader | 16,699 Posts

ITB - Seeing Orderliness amongst 'Randomness'
- #114
- Apr 25, 2019 7:53am Apr 25, 2019 7:53am
- Joined Jun 2010 | Status: Trader | 16,699 Posts
ITB - Seeing Orderliness amongst 'Randomness'
- #115
- Apr 25, 2019 8:01am Apr 25, 2019 8:01am
- Joined Jun 2010 | Status: Trader | 16,699 Posts
ITB - Seeing Orderliness amongst 'Randomness'
- #116
- Apr 25, 2019 9:34am Apr 25, 2019 9:34am
- Joined Jun 2010 | Status: Trader | 16,699 Posts
ITB - Seeing Orderliness amongst 'Randomness'
- #118
- Edited 11:49pm Apr 25, 2019 11:37pm | Edited 11:49pm
- Joined Jun 2010 | Status: Trader | 16,699 Posts
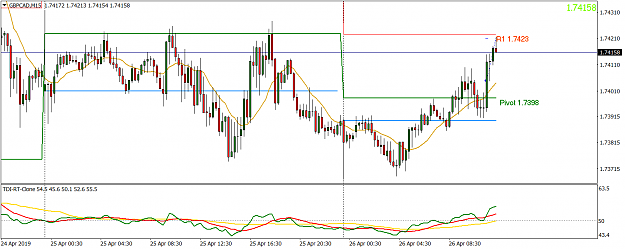
ITB - Seeing Orderliness amongst 'Randomness'
- #119
- Apr 26, 2019 1:53am Apr 26, 2019 1:53am
- Joined Jun 2010 | Status: Trader | 16,699 Posts
ITB - Seeing Orderliness amongst 'Randomness'