...that trading is all about support and resistance.
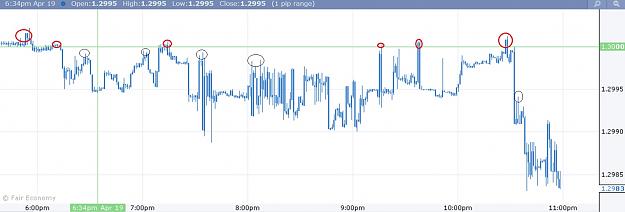
example -- price will go up and stop somewhere so i draw a resistance level there (remember that these levels are areas and not exact lines). from there, price will go down so i draw a support level there. then price will go sideways for a bit and attempt to break the levels that i drew. often, price will go back inside the range which is why i always wait for the pullback after the breakout before entering.
only time price will not stay sideways for a while is during strong trend... which isn't a big deal because it's easier to trade strong trends than ranging ones.
i used to download all the indicators i can and test them but in the end, it's all about simple support/resistance areas.