Hello Mr Trader - in the 5 min short time frame I see it dropping to 75.20 levels - 20 mins or so
Ignored
Hey Theoak, you mean the NZDJPY Trade ? This was not a Trade example this was a example that the dashboar was showing a divergency short trade but this is not a valid one
{quote} I notice that show RSI in the dashboard inputs. But I think its OBV in the data just in the description is RSI, and I usually use the exponencial moving average, and the dashboard came with simple in the inputs and this can show some setups that doesnt appear when using the exponencial mode. Apart from that the dashboard seens to monitor the signals in the right way, what is amazing. I'm now in a farm and not trading too much, but soon will get back in full mode, and the dashboard will be a great adition to my trading tools. Thansk again...
Ignored
That was some RSI inputs left over from a different indicator dashboard.
That is what I get for rushing...
It uses the OnBalanceVolume and all the moving averages for OBV and price, that you describe in the first post.
When the WHOLE BUTTON is GREEN, that is a BULLISH divergence.
When the WHOLE BUTTON is RED, that is a BEARISH divergence.
The indications are for CURRENT BAR.
Attached is an updated version 4.
Carl
PS. Due to the amount of data this indicator collects and all the moving average calculations, it may show a previous bars (or 10 or 20 bars) old signal. The only way to fix that is to change timeframes back and forth (or use a ForceHistoryLoad script). MT4 is quite slow in loading data from the broker servers.
{quote} That was some RSI inputs left over from a different indicator dashboard. That is what I get for rushing... It uses the OnBalanceVolume and all the moving averages for OBV and price, that you describe in the first post. When the WHOLE BUTTON is GREEN, that is a BULLISH divergence. When the WHOLE BUTTON is RED, that is a BEARISH divergence. The indications are for CURRENT BAR. Attached is an updated version 4. Carl PS. Due to the amount of data this indicator collects and all the moving average calculations, it may show a previous bars (or...
Ignored
I checked the Indicator now and the Signals are all correct.
So realy good work. But is it possible to create a new Chart ? instead of changing the Symbol in the Current Chart ?
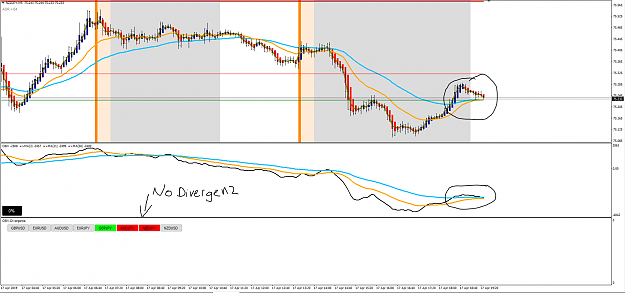
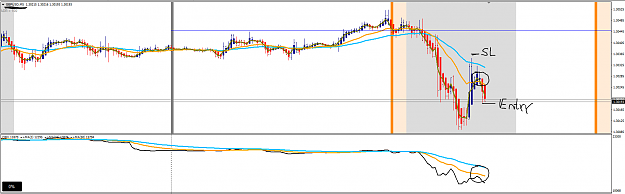
Here is a Live example again. Maybe i see it wrong but in my opinion its not a Divergency. Best regards {image}
Ignored
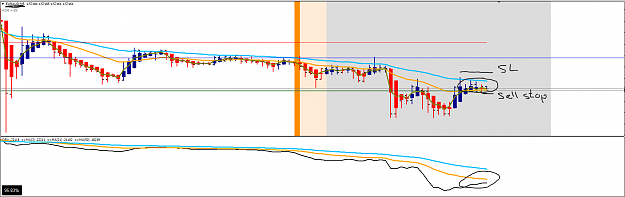
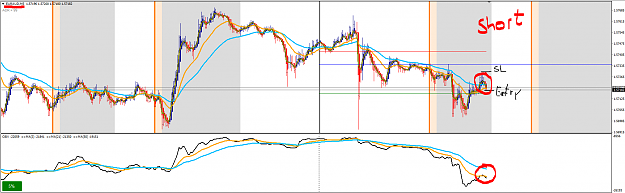
Mr.Trader123, unfortunately the indicator can only show you the context of the current bar. You still have to look at the past, with your eyes, to see if it really is a valid trade. The short indication is valid because price ma's show SHORT. Price MA3 is above both moving averages, but OBV MA3 is lower than MA50 which means volume is in a weaker position than price.
But, if you look at the past, 4 to 5 bars, you see that MA3 for both price and OBV were above both moving averages, so the signal is invalid.
{quote} I checked the Indicator now and the Signals are all correct. So realy good work. But is it possible to create a new Chart ? instead of changing the Symbol in the Current Chart ?
Ignored
Ok, good.
I can do that.
I'll have to make a parameter to ask if you want to do that or not. Not everyone may want to do that.
{quote} Mr.Trader123, unfortunately the indicator can only show you the context of the current bar. You still have to look at the past, with your eyes, to see if it really is a valid trade. The short indication is valid because price ma's show SHORT. Price MA3 is above both moving averages, but OBV MA3 is lower than MA50 which means volume is in a weaker position than price. But, if you look at the past, 4 to 5 bars, you see that MA3 for both price and OBV were above both moving averages, so the signal is invalid. Carl
Ignored
Hey my friend,
yeah you were right. I checked the Indikator and charts again and yeah that looks good so that ws a good work
and with creating new chart you were right it should be there the funktion to enable that, because maybe some people doesnt like it
{quote} Mr.Trader123, unfortunately the indicator can only show you the context of the current bar. You still have to look at the past, with your eyes, to see if it really is a valid trade. The short indication is valid because price ma's show SHORT. Price MA3 is above both moving averages, but OBV MA3 is lower than MA50 which means volume is in a weaker position than price. But, if you look at the past, 4 to 5 bars, you see that MA3 for both price and OBV were above both moving averages, so the signal is invalid. Carl
Ignored
Really Nice Work Carl!
I think it's a good thing to look the charts with our own eyes after the alert of the indicator.
Because we can in a glance see if its a valid setup and many times we can use a good Candle Pattern to enter the trade before the HekinAshi confirmation.
Thanks again!
Just one more thing. I dont now much of programing a indicator, but how difficult is to turn this indicator valid to MT5 too?
Because with MT5 we can use real data volume for many trade instruments and the signals are even better with real volume data.
And we could use in RenkoCharts with real volume, what is great.
Hello people! I bring something really great to share! Just a little bit of my story. I have been in the market for about 8 years, most of my operations are based on trend lines, Fibonacci and candle patterns in the 5min and 15min T.F. During that time as is the case with most I believe, I have always tried to develop systems to optimize my trading. So after much analysis on the fundamentals behind the price movement I came up with a really logical, mechanical and lucrative system, but unfortunately very restrictive too, because to increase the...
Ignored
Bamboopips, Thanks for sharing your valuable strategy here in FF, That's a great Method to confirm trade continuation ... seems that EA.v4 is showing setups correctly as well, ... to make it crystal clear, Would you please show us few examples of trigger candle and exact entry point based on entry rule: (The Entry is on the break of the High(Buy)/Low(Sell) of the Heiken Ashi candle that trigger the signal)
Thank you so much
If you don't build your DREAM, Someone will hire to help build theirs ...
{quote} Bamboopips, Thanks for sharing your valuable strategy here in FF, That's a great Method to confirm trade continuation ... seems that EA.v4 is showing setups correctly as well, ... to make it crystal clear, Would you please show us few examples of trigger candle and exact entry point based on entry rule: (The Entry is on the break of the High(Buy)/Low(Sell) of the Heiken Ashi candle that trigger the signal) Thank you so much
Ignored
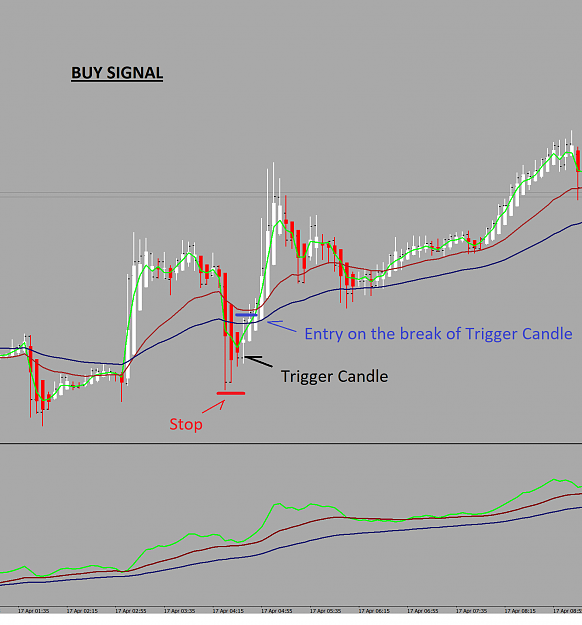
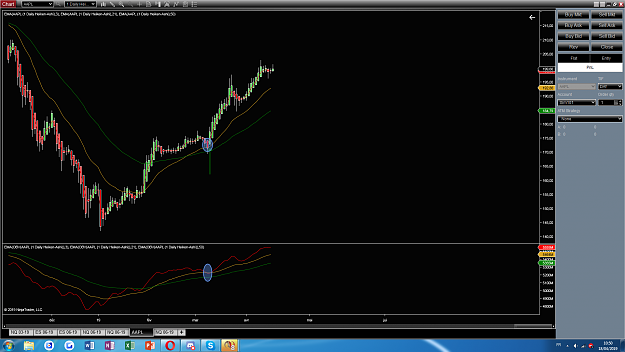
Hello. I'm on a course at a farm and unfortunately I can not operate normally these weeks. I'm just following the Brazilian index a little while I can, but next month I'm going to operate the Forex market again in full mode. But I'll post an example of a more detailed trade. It's a BUY signal in EURJPY, 5min. I hope it's clear.
{quote} Hello. I'm on a course at a farm and unfortunately I can not operate normally these weeks. I'm just following the Brazilian index a little while I can, but next month I'm going to operate the Forex market again in full mode. But I'll post an example of a more detailed trade. It's a BUY signal in EURJPY, 5min. I hope it's clear. {image}
Ignored
Thank you
If you don't build your DREAM, Someone will hire to help build theirs ...