Forex Factory
  • Home
  • Forums
  • Trades
  • News
  • Calendar
  • Market
  • Brokers
  • Login
  • User/Email: Password:
  • 3:05pm
  • Search
Menu
  • Forums
  • Trades
  • News
  • Calendar
  • Market
  • Brokers
  • Login
  • 3:05pm
Search

Options

Search
Search
Search

Bookmark Thread

First Page First Unread Last Page Last Post

Printable Version

Similar Threads

Day Trading vs. Swing Trading vs. Position Trading 84 replies

15m-5m-1m - Insainty's LFX Trading System 11 replies

  • Trading Discussion
  • /
  • Reply to Thread
  • Subscribe
  • 98
Attachments: LFX Trading Proverbs
Exit Attachments

LFX Trading Proverbs

  • Last Post
  •  
  • 1 1617181920 Page 21
  • 1 181920 Page 21
  •  
  • Post #401
  • Quote
  • Feb 4, 2019 7:35am Feb 4, 2019 7:35am
  •  dkrock
  • Joined Jul 2013 | Status: Member | 953 Posts
Quoting David0
Disliked
{quote} Thank you Dkrock for stepping in to reply. I will try different settings with the attached indicator as soon as I return from work by Gods grace. I'll let you know what I find out and where I find difficulties. I'll probably upload a chart if need be so you can understand me better. Thank you DK
Ignored
The thing to remember is that a time frame is just a time frame. They all draw the same patterns. They differ in range from high to low and in the frequency of the ranges. So once you decide what MA you want to use, you reproduce it on other time frames and compare the signals to find high probability trades. By further using a good oscillating indicator, you can introduce slowing, which helps limit MA chart head fakes. When it all agrees, you normally have a profitable trade. That is how you can use "mathematical" probability, or the average of averages, to increase your odds of winning trades. I recommend developing your MA template on a 30M chart and then modify it to fit your preferred time frame(s). Black out your candles and review your signals on historical charts. Add the color back to the candles and analyze your results for accuracy. Your goal is to beat the spread or at least break-even. Money is more easily made from risk than from pips. Not losing allows you to increase risk, so look for consistency, not precision. Good Luck.
Technical pirate cruising the markets
1
  • Post #402
  • Quote
  • Feb 11, 2019 5:23am Feb 11, 2019 5:23am
  •  David0
  • | New Member | Status: Member | 10 Posts
Dk, I hope your doing well. Please could you kindly explain the below statement of your in brackets, probably with a chart if possible. You can use any pair and time frame as I am aware you are also guiding your business secret. That statement of your is messing my head up, Loll. I'm really particular about knowing how to find the high and low of time period. You even mentioned it again in a reply you sent to me recently.

By time period, are you referring to time zone or time frame or numbers of a particular candles or what?? could you please explain with a chart???

When you say experiment with a moving average, are you referring to the moving average of the high and low you discovered??

And why is it that no body ever has an idea of some of the things you post or say??? Lol.
I sent a message to you some days ago( a gentle reminder).
Here is the statment I'm referring to
(For instance, if you use a CCI set to 14, then find the highs and lows of your time period and experiment with a moving average that the CCI will cross after the high or low is reached. Usually it is a factor of the period setting. So, if you use 14, then sample SMAs of 7, 14, 28, 42. When you find the MA that provides the most consistency, then remove it from your chart. Add the Bollinger band that matches your choice. Then attach the MA again with a different color.)
  • Post #403
  • Quote
  • Edited at 9:05pm Feb 11, 2019 5:49am | Edited at 9:05pm
  •  dkrock
  • Joined Jul 2013 | Status: Member | 953 Posts
Hi Dk, I hope your doing well. Please could you kindly explain the below statement of your in brackets, probably with a chart if possible. You can use any pair and time frame as I am aware you are also guiding your business secret. That statement of your is messing my head up, Loll. I'm really particular about knowing how to find the high and low of time period. You even mentioned it again in a reply you sent to me recently.

I find the highs and lows from changes in momentum between various time frames. When one time frame starts to quiver the other way, I compare it to another to determine if it is really turning or not. This allows me to exit and sit and wait for the second time frame to concur, ride it out because I don't think it is really turning, or exit and immediately enter the other way. It depends on how the apex is measured and defined with my indicators.

By time period, are you referring to time zone or time frame or numbers of a particular candles or what?? could you please explain with a chart???

I mean the time frame you want to trade. That will depend on your personal time, your personal goals, and your personal abilities.

When you say experiment with a moving average, are you referring to the moving average of the high and low you discovered??

There are many moving average experiments. The problem with trading is that while you can control the sample size, you cannot control the data within it. Each trade is a unique event, which is why price action and support/resistance traders typically lose most of their trades. Without averages, you cannot create a probability. There is no average in a candle shape or a line touch, so you have no data to predict future movement. It is a guess every time. Consider how a casino knows the odds of you winning or losing. It is from an average of events. So, if you are not measuring the averages of trading events, you are in a lot of trouble. By its very definition, your goal is to find the average. It does not have to be perfect. In fact, it cannot be. Once you have an average that is general enough in nature to normally show the distribution of trades, then you can use it to create a mean reversion via an oscillating indicator. That will normally show you the apex of price, or the high and low. To increase your consistency, you target an area just past each high and low so you are not involved in the consolidation and head fakes that can occur at the highs and lows. Those areas are designed to steal the money from the support/resistance traders by making them second guess their entries and whipsaw price as much as possible to make them panic and make mistakes. When you trade mean reversion, none of that manipulation affects you.

The point about putting on Bollinger bands first is due to the way the software works. If you want the bband to be against your signal line, then all the moving averages have to be off the indicator when you attach it. Otherwise, it might attach to a moving average, rather than your signal line. Just an oddity to be aware of.
Technical pirate cruising the markets
1
  • Post #404
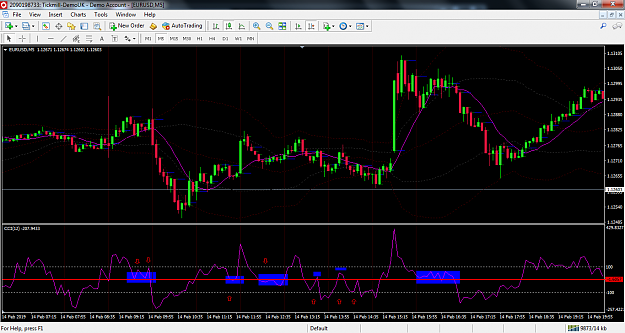
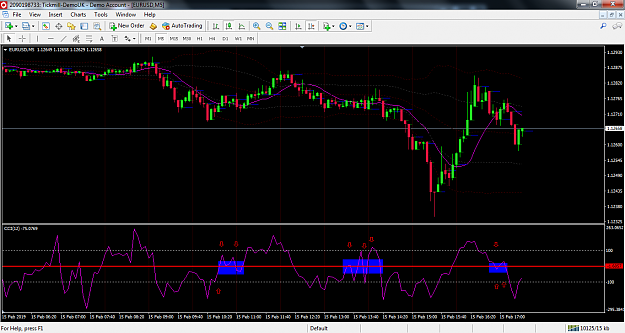
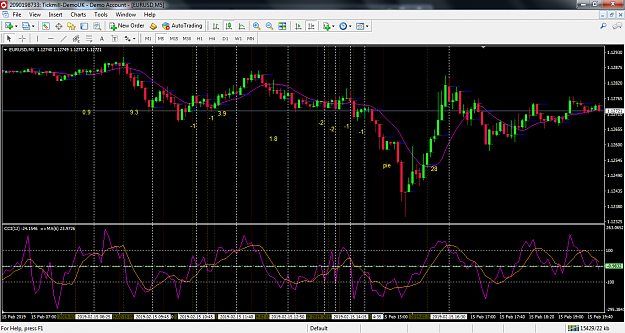
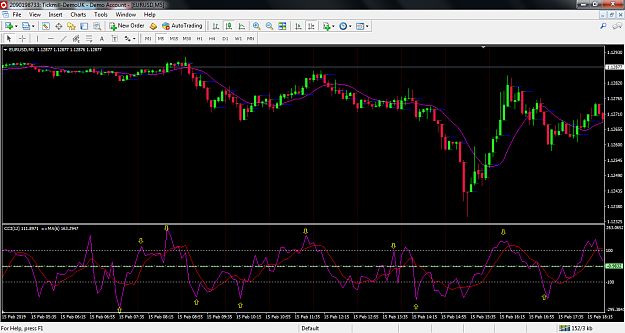
  • Quote
  • Feb 15, 2019 2:06pm Feb 15, 2019 2:06pm
  •  David0
  • | New Member | Status: Member | 10 Posts
Hi Dk, hope your doing well. sent details to your mail.
Attached Images (click to enlarge)
Click to Enlarge

Name: pic 1(equilibrium line).png
Size: 118 KB Click to Enlarge

Name: pic2 ( equi-line current day).png
Size: 112 KB Click to Enlarge

Name: pic3.png
Size: 121 KB Click to Enlarge

Name: pic4.png
Size: 102 KB
  • Post #405
  • Quote
  • Last Post: Feb 16, 2019 3:43am Feb 16, 2019 3:43am
  •  David0
  • | New Member | Status: Member | 10 Posts
Quoting dkrock
Disliked
Trigonometry defines the pattern you want to measure; the cosecant of the trade. Probability defines the data points that are most responsible for creating the cosecant. Trigonometry shows you its high and low after the trade. Probability shows you its high and low during the trade. As long as your probability is inside your cosecant (upper and lower values), you have a winning trade, depending upon the cosecant being larger than the spread and there is no human error in opening/closing the trade. The probability exit is also the next probability...
Ignored
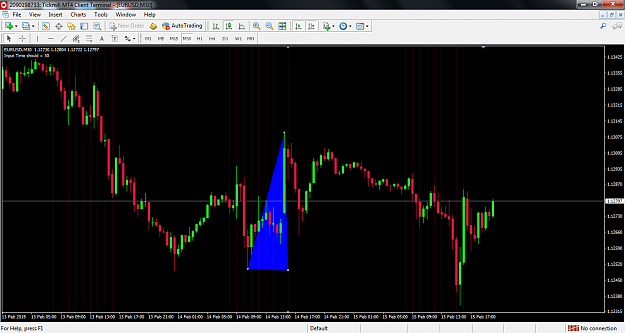
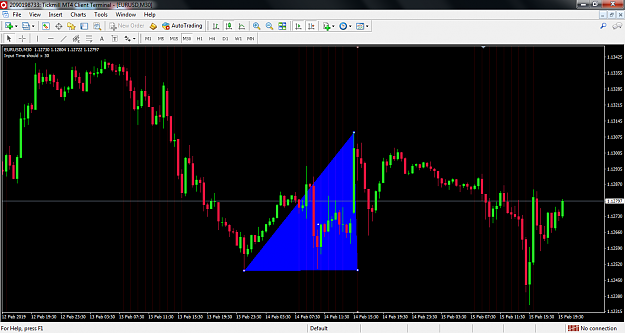
Hi DK, I dreamt about probabilities last night, so i woke up and read your thread from the beginning making it the 4th time this year and something in page 15, post 297 caught my attention. I have been seeing it but never really understood it up until today. I have tried to replicate it on 30M TF using yesterdays chat.
I have attached 2 charts. I want to know if my idea of cosecant triangle is Valid/correct in your opinion or if i'm missing something. If it is valid, which of the charts please?? Thank you as always.
Attached Images (click to enlarge)
Click to Enlarge

Name: cosecant1.png
Size: 94 KB Click to Enlarge

Name: cosececant.png
Size: 97 KB
Thread Tools Search this Thread
Show Printable Version Show Printable Version
Email This Thread Email This Thread
Search this Thread:

Advanced Search

  • Trading Discussion
  • /
  • LFX Trading Proverbs
  • Reply to Thread
    • 1 1617181920 Page 21
    • 1 181920 Page 21
0 traders viewing now
Top of Page
  • Facebook
  • Twitter
FF Website
  • Homepage
  • Search
  • Members
  • User Guide
  • Report a Bug
FF Products
  • Forums
  • Trades
  • Calendar
  • News
  • Market
  • Brokers
  • Trade Explorer
About FF
  • Mission
  • Products
  • Media Kit
  • Blog
  • Contact
Follow FF
  • Facebook
  • Twitter

Other Markets:

  • Crypto Craft
  • Energy EXCH
  • Metals Mine

Forex Factory® is a brand of Fair Economy, Inc.

Terms of Service / ©2019