Thank you very much for the charts and the time it took for explaining your way of trading Pitchfork. I checked them all. I honestly appreciate the effort and time. I always try to understand the methodology of other traders and you have explained it fairly enough.
@Winston
Regarding your explanation of trading structures within candle, you reminded me of a great old tip that I no longer use. For example if you have a congestion on H1, you can draw one candle or two which may take two and half days or 3/4 a day. Time periods do not matter. Good stuff!
and @Sossos
in one of your previous posts to another dear member, you reminded me of why we are trading pitchfork in the first place: "80 percent of the time we are targeting the median line." I almost forgot this statistical fact. "I believe it is proven"
I will add to this that pitchfork sometimes show a trend line before having the second touch.
---------------
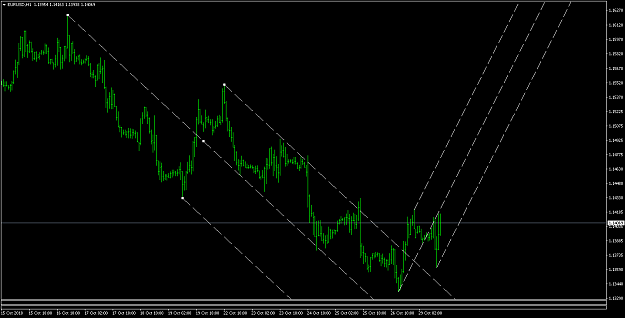
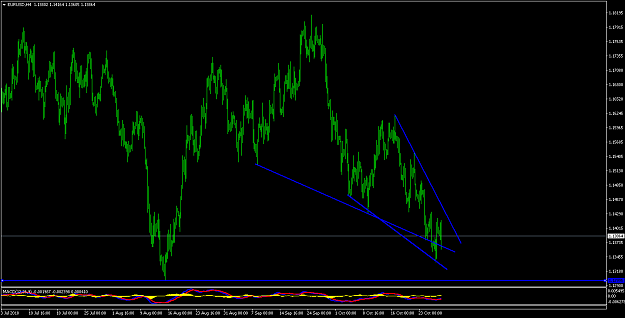
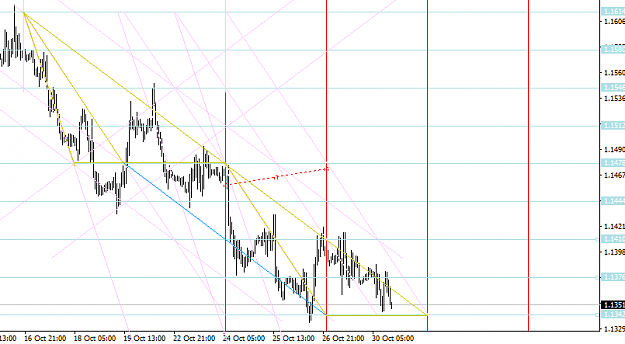
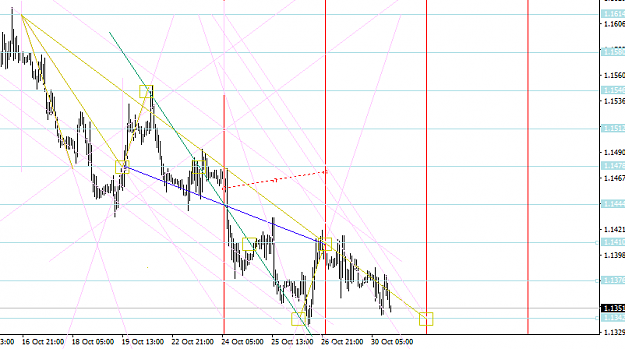
Anyway, I am posting now a chart for EURUSD. Now, after we had a shift in the bearish momentum, I believe we can draw another pitchfork in the other direction. It might be too early so the lower median line would be adjusted if price goes deeper than the previous swing.
NB: with H1 pitchfork, I will try applying the way I trade by looking for divergences or patterns on LTFs based on H1 median lines and ride the wave till the median line.
I will try to trade the same way you are trading here. I will see how I can incorporate pitchfork in my Pattern analysis. I will look for the happy medium or at least acquire another methodology of trading in one's arsenal.
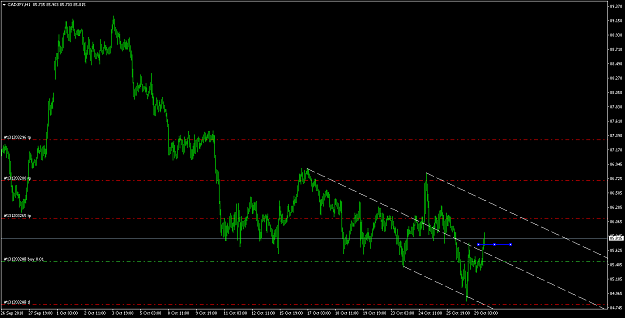
I went long with CADJPY for some PA analysis in this post Post #33
I did not want to clutter this thread with HA and divergence.
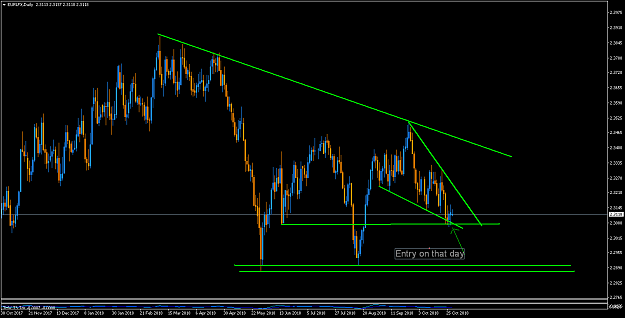
Then I thought what if I apply pitchfork to find how would I have entered.
In the chart attached, I would have entered after the breakout of median TL or better to wait for retest to median line. I drew many pitchforks on the chart but nothing made sense except for this one drawn.
Joined Mar 2009
|
Status: Hobby Trader
|4,477 Posts
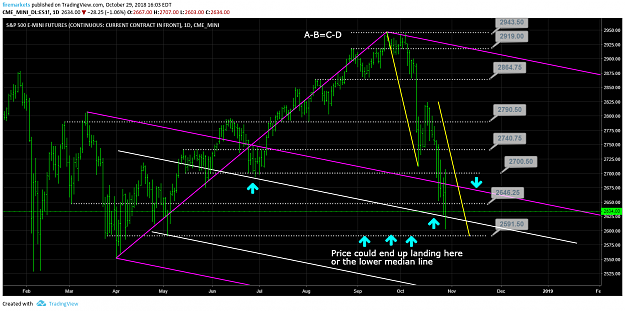
1. Plan the trade, trade the plan.
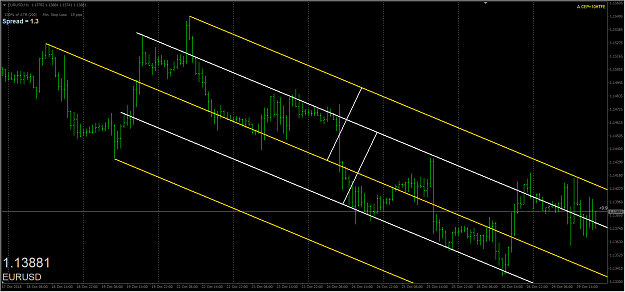
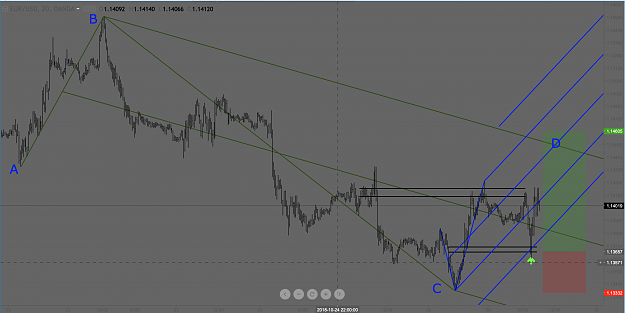
2. My swing is A to B. C to D is the projection that the fork suggests.
3. Before pivot C there is a coil. Before price descended to C it poked above then came down thus engulfing the coil. The rapid descent down is a sign to wait. Price then rapidly ascends and engulfs the engulf. Another way to see this is price overcoming a significant effort.
4. Price then ascends to the median line and encounters resistance at the WRB gap to the left. The resistance holds and price descends to the area where I previously described the engulf of the engulf. This is one of the situations where I personally will place pending orders. My minimum R:R is 2.5:1 and this is shown.
5. The green fork measures A to B and thus C to D.
6. The blue fork is drawn once price starts swinging upwards.
1. Plan the trade, trade the plan. 2. My swing is A to B. C to D is the projection that the fork suggests. 3. Before pivot C there is a coil. Before price descended to C it poked above then came down thus engulfing the coil. The rapid descent down is a sign to wait. Price then rapidly ascends and engulfs the engulf. Another way to see this is price overcoming a significant effort. 4. Price then ascends to the median line and encounters resistance at the WRB gap to the left. The resistance holds and price descends to the area where I previously described...
Ignored
It is interesting how you trade.
The difference between your style and mine is that you are measuring projections. My style is to enter 'as close as possible to a key swing.
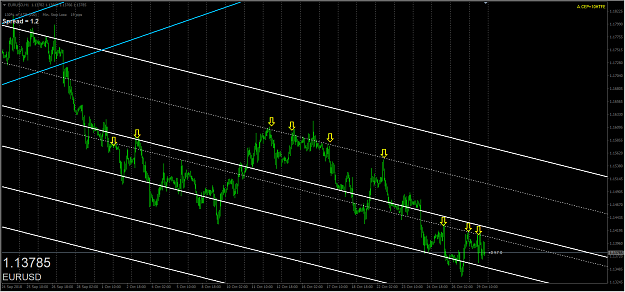
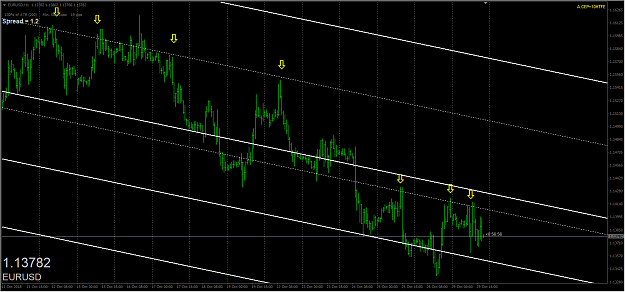
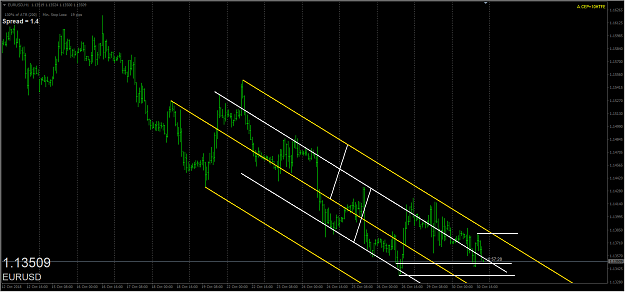
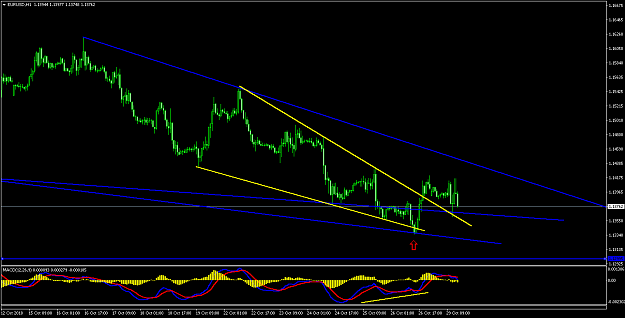
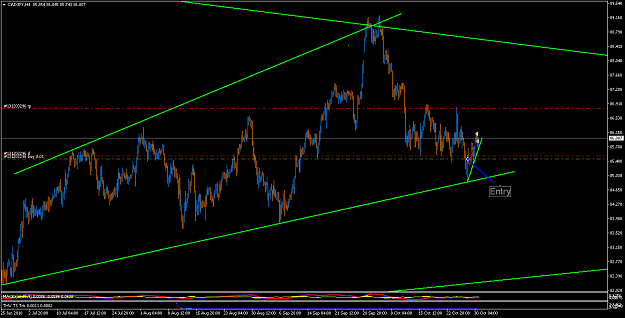
In the attached 4 hour, there is a lower line of a wedge for both H4 and Daily.
On H1, I drew some minor yellow lines.
In case I trade this pair, I would have looked for a reason to enter as close as possible to the red arrow. Price moved 80 pips. This immediate bounce is what I am after. How far price will go is not my concern in the time being (Iam trying to specialise on locating the immediate bounces). I readjust my targets according to fibs/S/R, etc or how price is reacting.
BTW, You will do great with harmonics.
I will sit and watch your setups. Thanks for your charts. I will go back to your previous posts. They need some time
Joined Mar 2009
|
Status: Hobby Trader
|4,477 Posts
I don't mean to preach but here I go. Forks project price or suggest a potential direction of future price. It is the SWINGS that one should concentrate on...NOT THE LINES. I know this seems completely at odds with what is erroneously perceived by those new to forks. Most of my trades occur not on the lines but after a pivot has formed. Often after a "C" pivot. Pivots make up swings. Swings make up forks.
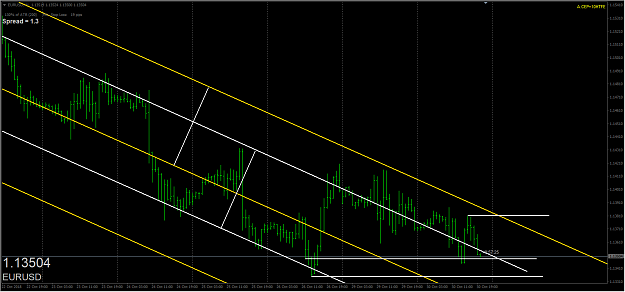
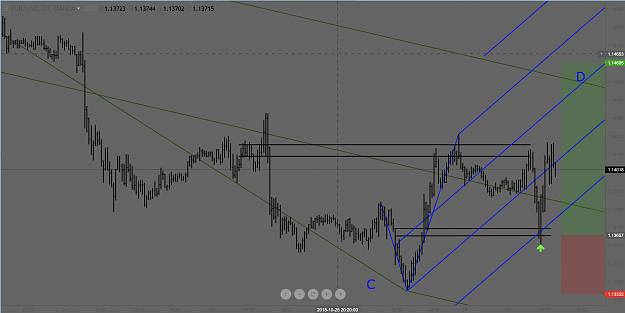
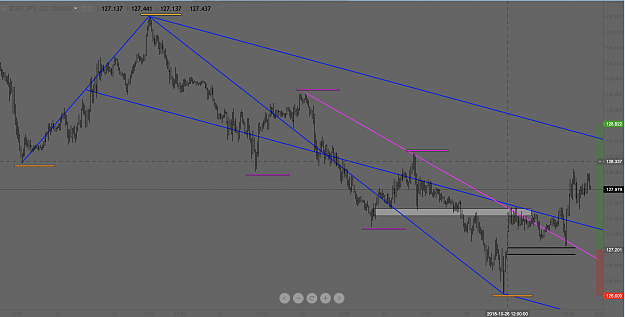
The chart below shows a blue modified down fork. The swing I am interested is A to B and after pivot C forms I am projecting price to ascend to D at the upper median line. Similar to the EURUSD I posted earlier this pair formed an impressive C pivot with a bullish WRB gap that found resistance at the median line. This satisfies Andrews rule. Make no mistake the median line is not magical and although Andrew's rule is true it is because of the way forks are drawn that seem to make the lines magical. Make no mistake price met resistance at the median line not because of the median line but because of sellers that are parked here as shown by price action to the left. Price "bumped"off this resistance and descended not quite to the base of the bullish WRB gap which is where I would have entered. Target is possible D near the upper median line.
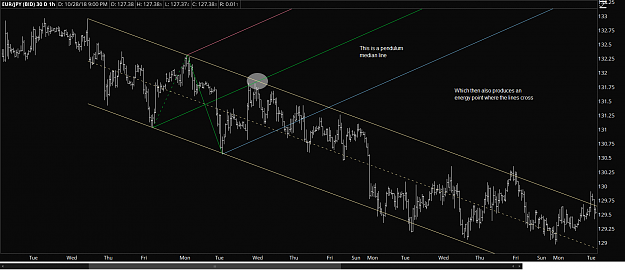
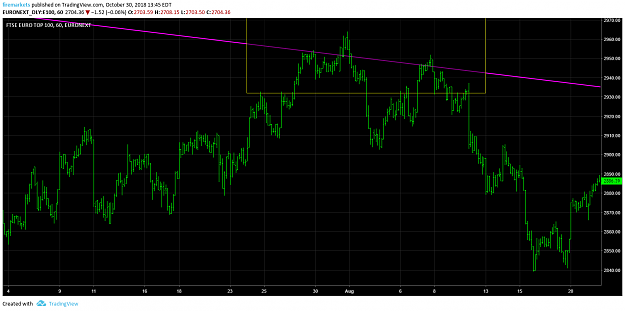
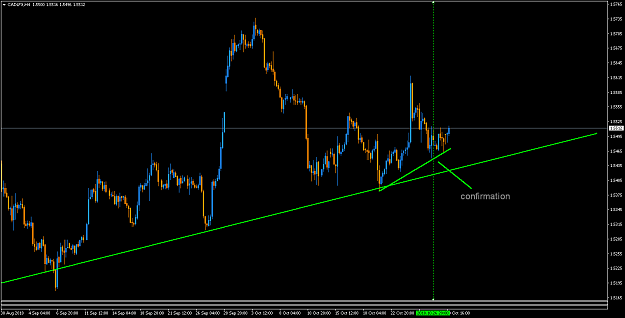
The pink trend line crosses the top of two relative swings. This line is like a "median line". Once price decisively moved above it, it came back to test the back side. This is a technique that can be used in various scenarios as a sort of confirmation.
I am very impressed when you see your charts Eaglestar. Very good work. But i dont understand anything, but i like it !
Ignored
Thank you Kovalenko, I am so happy to see you again! how are things? Please post your work so we can all learn. Good to see you. I have looked at many many charts and forks over the years, and put in a lot of work to learn this, but please share your support and resistance work as well. You are more than welcome here.
The things that we love tell us what we are Thanks Redsword11 and Tim Morge
@Winston Reed and eaglestar, and all valuable traders.
I need your view or feedback about analysing individual currency indices. For long I have been concerned with them trying to exploit what I believe might be a hidden gem. Nevertheless, your views about he matter is important for me.
I checked most of forex factory threads and I have not found any one that really delved into the matter. Most of the threads talk about correlation or an indicator showing few lines representing currencies that are crossing or diverting. Naaa. This not what indices are about. I want to analyse a chart.
If any one is interested in checking the idea and apply any sort of analysis including pitchfork, I am happy to continue further with it. There are some advantages and "Limitations" as well.
Any way, I am here showing an example of what I mean.
EUR Index:
On the daily chart, price may have found support on the 'right shoulder' of an inverse H&S (loosely calling it so as the shoulder is very close to the bottom). It is also bouncing from an alternate TL of a 'falling wedge'. There is some bullishness expected at the arrow. We will consider for now the second blue daily candle at support.
Attached Image (click to enlarge)
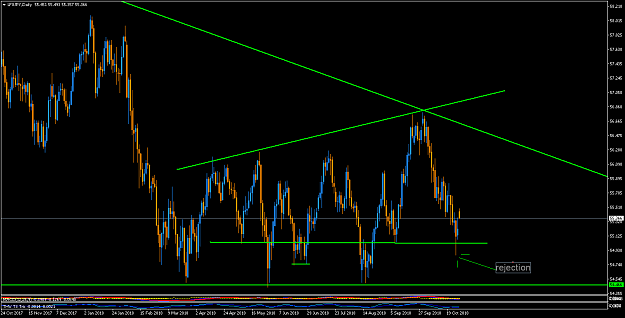
JPY Index: (Please note that this chart is inverted. It is other currencies vs Yen)
On the daily chart, we have a strong rejection of a previous support. We will consider for now the first blue candle after the rejection.
Please note that this bullishness is actually "Bearishness" because the chart of Yen is inverted.
Attached Image (click to enlarge)
Ok so we had a bullish reaction for Euro and a bearish reaction for Yen
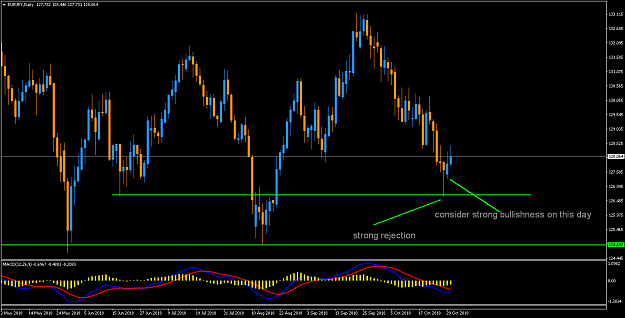
So lets have a look at EURJPY
Daily: We have a daily support and is bit confusing which level would hold.... Would it be the high or the low of the zone? . But because of the above indices charts, we can make sure that price found support especially with the big daily hammer.
@Winston Reed and eaglestar, and all valuable traders. I need your view or feedback about analysing individual currency indices. For long I have been concerned with them trying to exploit what I believe might be a hidden gem. Nevertheless, your views about he matter is important for me. I checked most of forex factory threads and I have not found any one that really delved into the matter. Most of the threads talk about correlation or an indicator showing few lines representing currencies that are crossing or diverting. Naaa. This not what indices...
Ignored
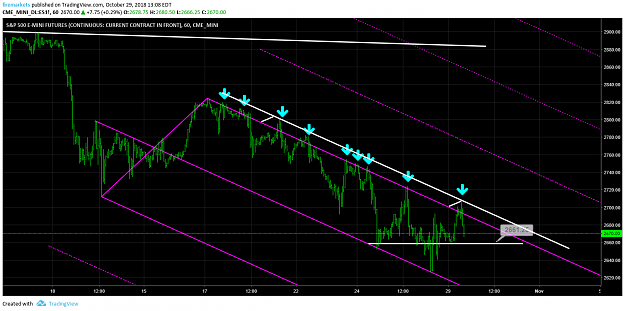
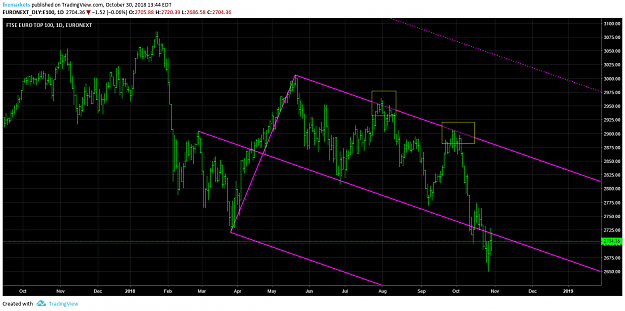
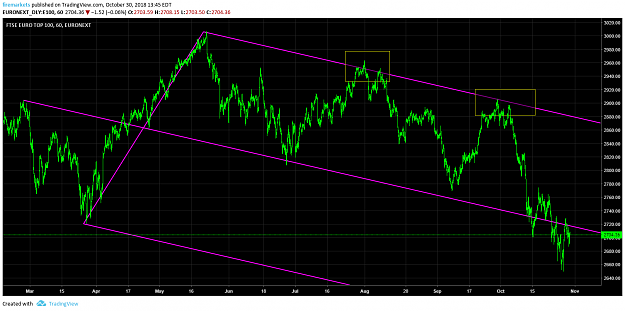
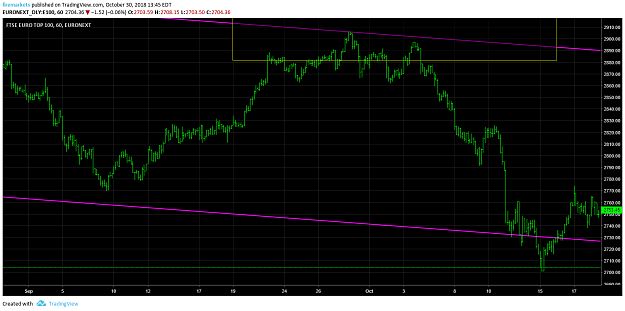
The Median Line (Andrews Pitchfork) can work on anything that can be measured. I would say that it would be easier to draw a larger daily or weekly fork and use those as support and resistance points. Take a look at this recent fork in the Euro FTSE Index. Notice where price drops. Zoom in to the 1h and see where the price drops. It would be easier to snipe your entry using price alerts, then drawing many multi timeframe charts in my opinion.
In addition: In my research I have found the Daily/1h or the 4h/15min to be the best dual timeframe to enter with a smaller stop.
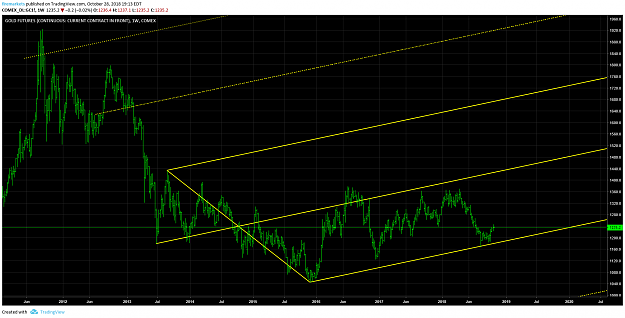
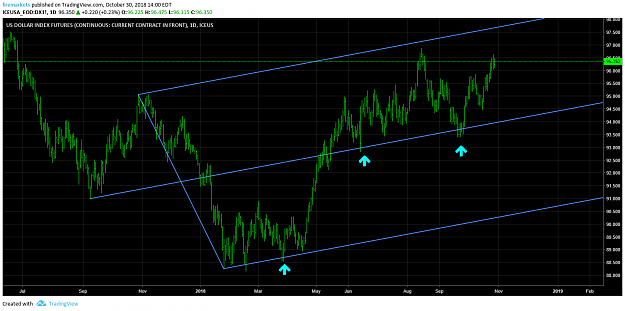
I have also added a chart of the US Dollar Index with moves off the Daily Pitchfork
Attached Image(s) (click to enlarge)
The things that we love tell us what we are Thanks Redsword11 and Tim Morge
[quote=eaglestar;11640117]{quote} The Median Line (Andrews Pitchfork) can work on anything that can be measured. I would say that it would be easier to draw a larger daily or weekly fork and use those as support and resistance points. Take a look at this recent fork in the Euro FTSE Index. Notice where price drops.
The charts are self explanatory and look great....
Generally speaking, I am looking for other variables to confirm my bias, same as some forex traders do with the COT report.
It is important indeed to check the performance of companies or stock indices in any country/zone. The currency will follow.
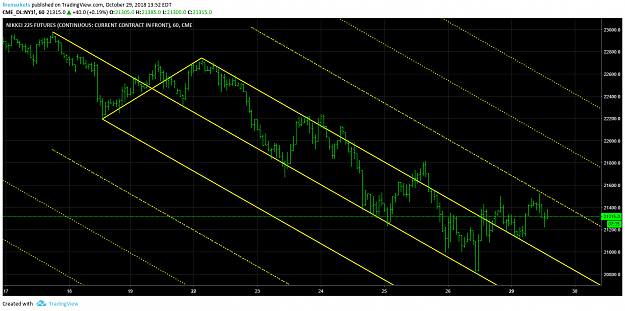
This is an important 'variable' that will boost the performance of any forex trader. We can do the same with Nikki for yen or ASX for Australia....This also brings the question of which indices are more important for daily/weekly perspective or more correlated with currencies.
The indices I posted above are not tradable instruments BTW. They are synthetic charts showing the behaviour of a currency against the other seven pairs. It has an average weighing and does not give more weight to some currencies over the others.
The problem with USD Index (the tradable one that many brokers offer) is that it is not averagely weighed. I have another one that does this. One can argue though that the performance of NZD dollar or CHF against the US dollar is not really significant to be given an equal weight.
I used this technique recently with my last two trades :Long EURCHF and Long CADJPY. Both are doing well so far.
A year ago, I was talking to a friend (actually preaching him) of the importance of checking stock indices to evaluate the currency. I have not done that since then! Thanks for bringing this here in this thread. I hope others benefit from this.
.....With Median forks, I am still experimenting on HTF.. and experimenting the technique on snipering my entries..
The combination of MTF (Daily/H1) or H4/M15 you mentioned is a good classic one and is followed by many but from my experience, the combnation is not enough. The full picture changes from one pair to another and from one overall structure to another.
Sometimes the Weekly chart has nothing to tell while the monthly and H4 are complementing each other. Or may be the 15 min chart is working in harmony with daily chart. Each trade has its own characteristics and ins and outs.