I have struggled for a long time with visual backtesting in MT4 and always asked me why is this.
My requirements were:
1) hiding the price to the right(future) to the current observed bar, so my decision whether a signal should be taken is neutral and not influenced by the outcome. Otherwise you may end up skipping/overlooking some of the bad signals, and its not a realistic backtest any more.
2) be able to check other timeframes, again hiding the prices to the right
3) skipping uninteresting bars quickly, and not having to wait until you see the next interesting signal
Although it´s possible to visually backtest in Strategy Tester, it only satisfies my first requirement.
I am not aware of other tools which provide all of the three.
Even ForexTester which costs something does not give me requirement 3), and what´s worse it does not read my MT4 templates and indicators.
Here is my attempt to do what I need with MT4.
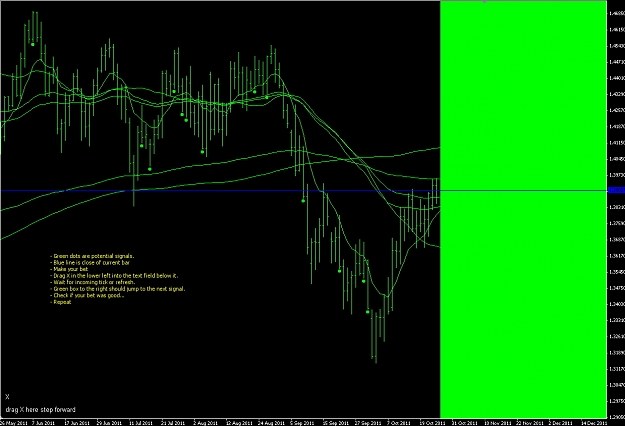
- It places an Rectangle over the chart to the right of the bar you are observing to hide future prices. To get that to work all elements on the chart including price bars and moving averages have to be in the same color as its not possible in MT4 to place the rectangle in the foreground.
This means that you can not use candlesticks as you can not see if it´s a bearish or bullish bar when they all have the same color, so use OHLC bars.
- It steps to the next signal an indicator (painting historical bars) gives you. The limitation here is that your indicator paints the signal on the main chart, again in the same single color. The signal has to mark each bar of your interest with an "object". I have tested this with text fields. The name of the objects generated by the indicator have to start with a constant prefix so they can be identified when jumping from one signal bar to the next. For example pinbar1,pinbar2,pinbar3 etc.
- The command for stepping is triggered by moving an "X" character into another target text field. As MT4 code is only executed when new tick data arrives, this only works when the market is open OR you select "refresh" in the context menu after giving the command for stepping.
- A blue horizontal line shows the closing price of the current candle. This is needed because the close of the OHLC is hidden by rectangle to the right.
- Place a vertical line on the chart to indicate where the testing should start, then add your signal indicator, then the attached file.
Well I guess that´s all hard to digest as the whole thing is a big workaround around MT4s lack of support for doing it nicely.
More instructions will follow..
Good luck :nerd:
My requirements were:
1) hiding the price to the right(future) to the current observed bar, so my decision whether a signal should be taken is neutral and not influenced by the outcome. Otherwise you may end up skipping/overlooking some of the bad signals, and its not a realistic backtest any more.
2) be able to check other timeframes, again hiding the prices to the right
3) skipping uninteresting bars quickly, and not having to wait until you see the next interesting signal
Although it´s possible to visually backtest in Strategy Tester, it only satisfies my first requirement.
I am not aware of other tools which provide all of the three.
Even ForexTester which costs something does not give me requirement 3), and what´s worse it does not read my MT4 templates and indicators.
Here is my attempt to do what I need with MT4.
- It places an Rectangle over the chart to the right of the bar you are observing to hide future prices. To get that to work all elements on the chart including price bars and moving averages have to be in the same color as its not possible in MT4 to place the rectangle in the foreground.
This means that you can not use candlesticks as you can not see if it´s a bearish or bullish bar when they all have the same color, so use OHLC bars.
- It steps to the next signal an indicator (painting historical bars) gives you. The limitation here is that your indicator paints the signal on the main chart, again in the same single color. The signal has to mark each bar of your interest with an "object". I have tested this with text fields. The name of the objects generated by the indicator have to start with a constant prefix so they can be identified when jumping from one signal bar to the next. For example pinbar1,pinbar2,pinbar3 etc.
- The command for stepping is triggered by moving an "X" character into another target text field. As MT4 code is only executed when new tick data arrives, this only works when the market is open OR you select "refresh" in the context menu after giving the command for stepping.
- A blue horizontal line shows the closing price of the current candle. This is needed because the close of the OHLC is hidden by rectangle to the right.
- Place a vertical line on the chart to indicate where the testing should start, then add your signal indicator, then the attached file.
Well I guess that´s all hard to digest as the whole thing is a big workaround around MT4s lack of support for doing it nicely.
More instructions will follow..
Good luck :nerd:
Attached Image (click to enlarge)
Attached File(s)